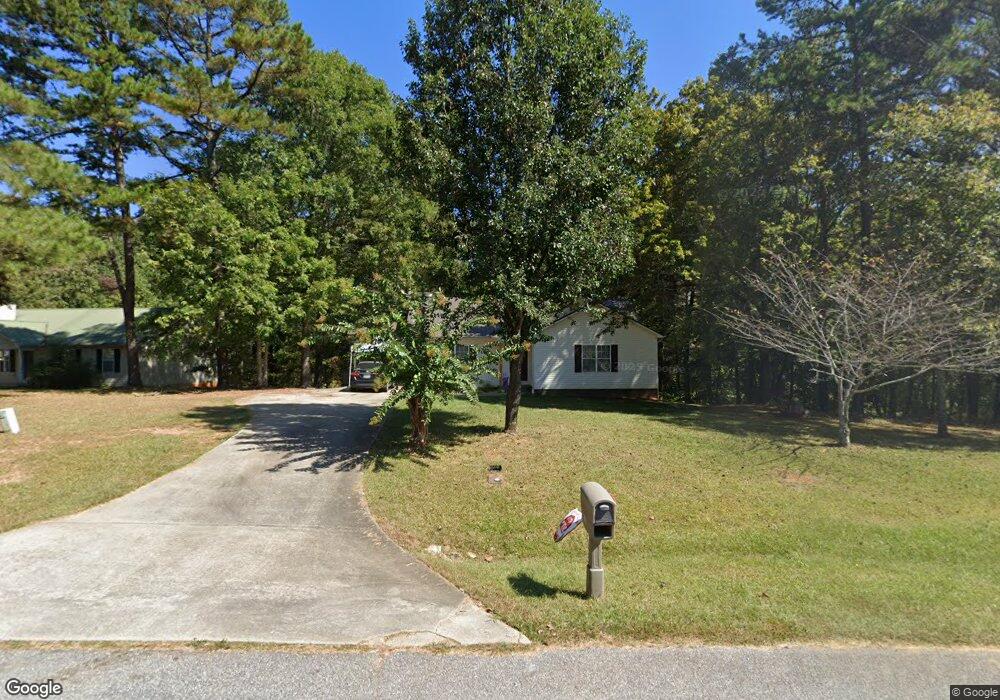
18 Chickasaw Trail Cleveland, GA 30528
Estimated Value: $279,856 - $310,000
3
Beds
2
Baths
1,276
Sq Ft
$233/Sq Ft
Est. Value
About This Home
This home is located at 18 Chickasaw Trail, Cleveland, GA 30528 and is currently estimated at $297,464, approximately $233 per square foot. 18 Chickasaw Trail is a home located in White County with nearby schools including White County 9th Grade Academy, Mount Yonah Elementary School, and White County Middle School.
Ownership History
Date
Name
Owned For
Owner Type
Purchase Details
Closed on
Nov 24, 2021
Sold by
Smith Lodonna Dee
Bought by
Bryson Alexander and Bryson Whitney
Current Estimated Value
Home Financials for this Owner
Home Financials are based on the most recent Mortgage that was taken out on this home.
Original Mortgage
$186,240
Outstanding Balance
$170,055
Interest Rate
3.05%
Mortgage Type
New Conventional
Estimated Equity
$127,409
Purchase Details
Closed on
Oct 9, 2012
Sold by
Meaders M Jason
Bought by
Meaders Iadonna Dee
Purchase Details
Closed on
Jan 3, 2012
Sold by
Roberts Matthew
Bought by
Meaders M Jason
Purchase Details
Closed on
Sep 1, 2006
Sold by
Not Provided
Bought by
Roberts Matthew Wayne
Home Financials for this Owner
Home Financials are based on the most recent Mortgage that was taken out on this home.
Original Mortgage
$64,200
Interest Rate
6.58%
Mortgage Type
New Conventional
Create a Home Valuation Report for This Property
The Home Valuation Report is an in-depth analysis detailing your home's value as well as a comparison with similar homes in the area
Home Values in the Area
Average Home Value in this Area
Purchase History
| Date | Buyer | Sale Price | Title Company |
|---|---|---|---|
| Bryson Alexander | $192,000 | -- | |
| Meaders Iadonna Dee | -- | -- | |
| Meaders M Jason | $49,524 | -- | |
| Roberts Matthew Wayne | $108,000 | -- |
Source: Public Records
Mortgage History
| Date | Status | Borrower | Loan Amount |
|---|---|---|---|
| Open | Bryson Alexander | $186,240 | |
| Previous Owner | Roberts Matthew Wayne | $64,200 |
Source: Public Records
Tax History Compared to Growth
Tax History
| Year | Tax Paid | Tax Assessment Tax Assessment Total Assessment is a certain percentage of the fair market value that is determined by local assessors to be the total taxable value of land and additions on the property. | Land | Improvement |
|---|---|---|---|---|
| 2025 | $1,900 | $91,208 | $13,800 | $77,408 |
| 2024 | $1,900 | $91,208 | $13,800 | $77,408 |
| 2023 | $1,796 | $79,204 | $11,500 | $67,704 |
| 2022 | $1,664 | $70,136 | $11,500 | $58,636 |
| 2021 | $1,288 | $48,060 | $9,600 | $38,460 |
| 2020 | $1,065 | $41,104 | $8,000 | $33,104 |
| 2019 | $1,068 | $41,104 | $8,000 | $33,104 |
| 2018 | $1,054 | $40,304 | $7,200 | $33,104 |
| 2017 | $1,009 | $36,060 | $7,200 | $28,860 |
| 2016 | $1,009 | $36,060 | $7,200 | $28,860 |
| 2015 | $963 | $90,150 | $7,200 | $28,860 |
| 2014 | $898 | $83,880 | $0 | $0 |
Source: Public Records
Map
Nearby Homes
- 164 Leatherford Rd
- 0 Highway 115 E Unit 10627896
- 675 Washboard Rd
- 22 Laurel Park Dr
- 0 Black Rd Unit 7662078
- 0 Black Rd Unit 10620540
- 79 Hampton Hills Ln
- 0 Holiness Campground Rd Unit 10629188
- 00 Freeman Rd
- 0 Freeman Rd Unit LOT 3 10539998
- 0 Freeman Rd Unit LOT 4
- 0 Freeman Rd Unit LOT 2 10539989
- 1021 Black Rd
- 915 Holiness Campground Rd
- 77 N Shore Dr
- 179 Pine Brook Dr
- 841 Yonah Meadow Dr
- 0 Highland Forest Rd Unit TRACT "2" 10559371
- 2011 Lothridge Rd
- 61 Berry Patch Ln
- 58 Chickasaw Trail
- 19 Chickasaw Trail
- 84 Chickasaw Trail
- 53 Chickasaw Trail
- 87 Chickasaw Trail
- 61 Chickasaw Trail
- 94 Chickasaw Trail
- 338 Leatherford Rd
- 279 Leatherford Rd
- 279 Leatherford Rd Unit 50
- 135 Chickasaw Trail
- 103 Chickasaw Trail
- 103 Chickasaw Trail Unit 6
- 478 Leatherford Rd
- 478 Leatherford Rd
- 451 Leatherford Rd
- 134 Chickasaw Trail
- 256 Leatherford Rd Unit 69
- 256 Leatherford Rd
- 461 Leatherford Rd