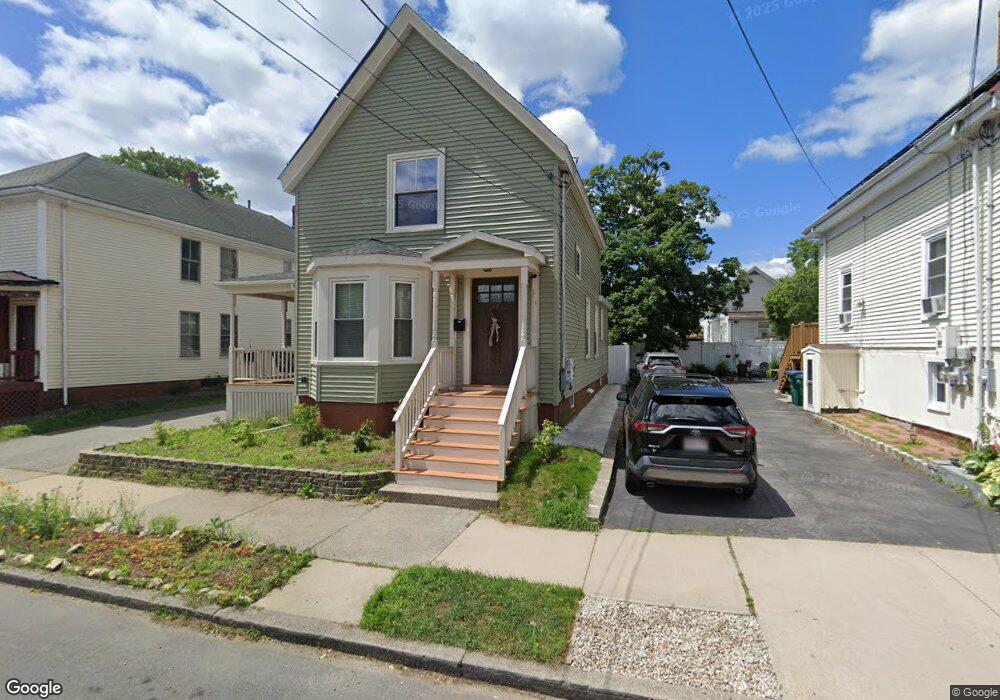
18 Coburn St Lynn, MA 01902
Chatham Street NeighborhoodEstimated Value: $535,000 - $573,362
3
Beds
2
Baths
1,504
Sq Ft
$371/Sq Ft
Est. Value
About This Home
This home is located at 18 Coburn St, Lynn, MA 01902 and is currently estimated at $558,341, approximately $371 per square foot. 18 Coburn St is a home located in Essex County with nearby schools including Ingalls Elementary School, William R. Fallon School, and Marshall Middle School.
Ownership History
Date
Name
Owned For
Owner Type
Purchase Details
Closed on
Feb 21, 2023
Sold by
Abbott Christopher M
Bought by
Shipp Johnny D and Shipp Heather L
Current Estimated Value
Home Financials for this Owner
Home Financials are based on the most recent Mortgage that was taken out on this home.
Original Mortgage
$441,500
Outstanding Balance
$427,545
Interest Rate
6.48%
Mortgage Type
Purchase Money Mortgage
Estimated Equity
$130,796
Purchase Details
Closed on
Jul 10, 2009
Sold by
Johansson Daniel
Bought by
Abbott Christopher M
Home Financials for this Owner
Home Financials are based on the most recent Mortgage that was taken out on this home.
Original Mortgage
$190,000
Interest Rate
4.93%
Mortgage Type
Purchase Money Mortgage
Purchase Details
Closed on
Dec 6, 2002
Sold by
Est Burns Jean E and Perry Anita L
Bought by
Johansson Daniel
Create a Home Valuation Report for This Property
The Home Valuation Report is an in-depth analysis detailing your home's value as well as a comparison with similar homes in the area
Home Values in the Area
Average Home Value in this Area
Purchase History
| Date | Buyer | Sale Price | Title Company |
|---|---|---|---|
| Shipp Johnny D | $477,000 | None Available | |
| Abbott Christopher M | $200,000 | -- | |
| Abbott Christopher M | $200,000 | -- | |
| Johansson Daniel | $172,000 | -- | |
| Johansson Daniel | $172,000 | -- |
Source: Public Records
Mortgage History
| Date | Status | Borrower | Loan Amount |
|---|---|---|---|
| Open | Shipp Johnny D | $441,500 | |
| Previous Owner | Johansson Daniel | $184,000 | |
| Previous Owner | Johansson Daniel | $190,000 |
Source: Public Records
Tax History
| Year | Tax Paid | Tax Assessment Tax Assessment Total Assessment is a certain percentage of the fair market value that is determined by local assessors to be the total taxable value of land and additions on the property. | Land | Improvement |
|---|---|---|---|---|
| 2025 | $5,268 | $508,500 | $197,000 | $311,500 |
| 2024 | $5,078 | $482,200 | $187,600 | $294,600 |
| 2023 | $4,924 | $441,600 | $182,900 | $258,700 |
| 2022 | $4,774 | $384,100 | $152,600 | $231,500 |
| 2021 | $4,533 | $347,900 | $131,600 | $216,300 |
| 2020 | $4,343 | $324,100 | $124,400 | $199,700 |
| 2019 | $4,356 | $304,600 | $116,300 | $188,300 |
| 2018 | $4,118 | $271,800 | $113,300 | $158,500 |
| 2017 | $3,905 | $250,300 | $100,000 | $150,300 |
| 2016 | $3,733 | $230,700 | $88,500 | $142,200 |
| 2015 | $3,437 | $205,200 | $80,400 | $124,800 |
Source: Public Records
Map
Nearby Homes
- 106 Williams Ave
- 129 Marianna St
- 30 Clifton Ave
- 129 Williams Ave
- 122-126 Marianna St
- 162 Chatham St
- 4 Valley Rd Unit 4
- 50 Webster St
- 16 Isabella St
- 238 Essex St
- 7 Sidney Ave
- 60 Roy St
- 97 Seymour Ave
- 11 Birch St
- 80 Collins St
- 16 Clinton St
- 17 Marianna St
- 82 Fayette St
- 96 Burpee Rd Unit 1
- 146 Burrill St
Your Personal Tour Guide
Ask me questions while you tour the home.