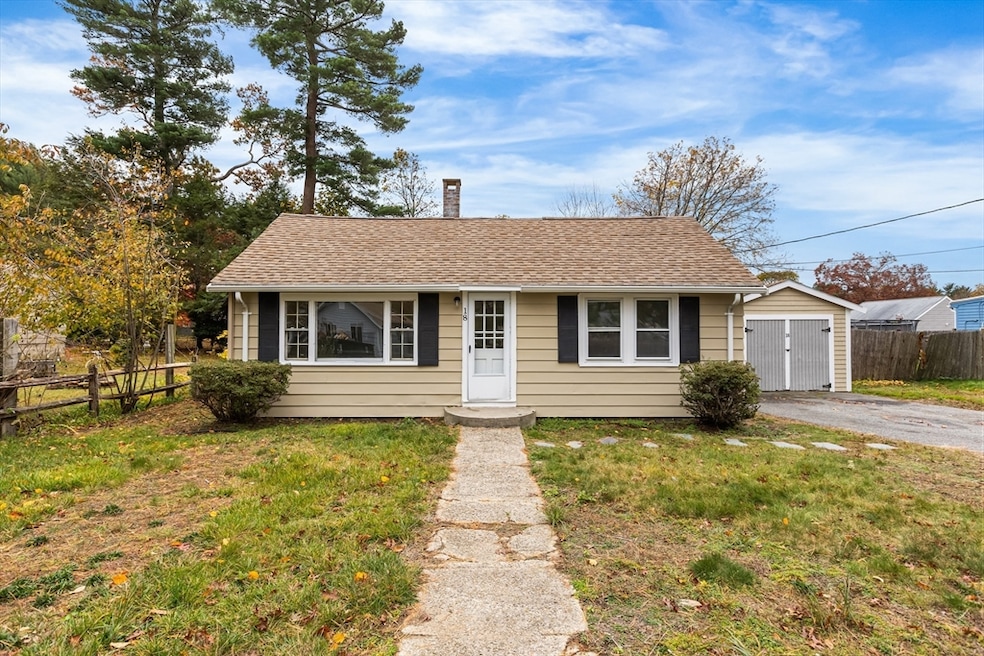


18 Colby St Rockland, MA 02370
Estimated payment $3,028/month
Highlights
- Hot Property
- Wooded Lot
- No HOA
- In Ground Pool
- Ranch Style House
- Patio
About This Home
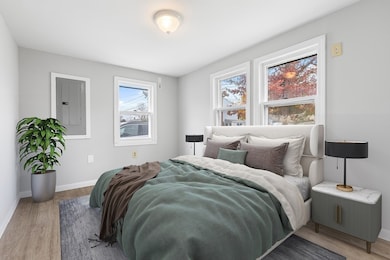
Well maintained home with a detached ADU unit. Main home is a 3 bedroom Ranch. Nice open floor plan. Large eat in kitchen. Spacious living room. 3 full sized bedrooms. Main bedroom has sliders that lead out to a beautiful patio. Laundry hookup on main level for convenience. Detached ADU is a studio unit perfect for teen or in-laws. Seller willing to buy down the mortgage rate on this home. PLEASE BOOK SHOWINGS THROUGH SHOWINGTIME.
Home Details
Home Type
- Single Family
Est. Annual Taxes
- $5,426
Year Built
- Built in 1920
Lot Details
- 8,000 Sq Ft Lot
- Wooded Lot
Home Design
- Ranch Style House
- Block Foundation
- Frame Construction
- Shingle Roof
Interior Spaces
- 1,100 Sq Ft Home
- Laminate Flooring
- Crawl Space
- Washer and Electric Dryer Hookup
Kitchen
- Range
- Microwave
- Dishwasher
Bedrooms and Bathrooms
- 4 Bedrooms
- 2 Full Bathrooms
Parking
- 2 Car Parking Spaces
- Off-Street Parking
Outdoor Features
- In Ground Pool
- Bulkhead
- Patio
- Outdoor Storage
- Rain Gutters
Additional Homes
- Accessory Dwelling Unit (ADU)
Utilities
- No Cooling
- Forced Air Heating System
- Heating System Uses Natural Gas
- Electric Baseboard Heater
Community Details
- No Home Owners Association
Listing and Financial Details
- Assessor Parcel Number M:10 B:0 L:58,1154774
Map
Home Values in the Area
Average Home Value in this Area
Tax History
| Year | Tax Paid | Tax Assessment Tax Assessment Total Assessment is a certain percentage of the fair market value that is determined by local assessors to be the total taxable value of land and additions on the property. | Land | Improvement |
|---|---|---|---|---|
| 2025 | $5,426 | $396,900 | $224,000 | $172,900 |
| 2024 | $5,268 | $374,700 | $211,300 | $163,400 |
| 2023 | $5,240 | $344,300 | $193,900 | $150,400 |
| 2022 | $4,936 | $294,700 | $168,600 | $126,100 |
| 2021 | $4,572 | $264,600 | $153,200 | $111,400 |
| 2020 | $4,422 | $252,700 | $146,000 | $106,700 |
| 2019 | $4,322 | $241,200 | $139,000 | $102,200 |
| 2018 | $4,065 | $223,100 | $139,000 | $84,100 |
| 2017 | $4,003 | $216,600 | $139,000 | $77,600 |
| 2016 | $3,857 | $208,600 | $133,700 | $74,900 |
| 2015 | $3,688 | $193,800 | $124,900 | $68,900 |
| 2014 | $3,266 | $178,100 | $110,300 | $67,800 |
Property History
| Date | Event | Price | List to Sale | Price per Sq Ft |
|---|---|---|---|---|
| 11/07/2025 11/07/25 | For Sale | $489,900 | -- | $445 / Sq Ft |
Purchase History
| Date | Type | Sale Price | Title Company |
|---|---|---|---|
| Quit Claim Deed | $290,000 | -- | |
| Quit Claim Deed | $325,000 | -- | |
| Quit Claim Deed | -- | None Available | |
| Land Court Massachusetts | -- | -- | |
| Land Court Massachusetts | -- | -- |
Mortgage History
| Date | Status | Loan Amount | Loan Type |
|---|---|---|---|
| Previous Owner | $86,000 | No Value Available | |
| Previous Owner | $86,900 | No Value Available | |
| Previous Owner | $45,000 | No Value Available |
Source: MLS Property Information Network (MLS PIN)
MLS Number: 73452725
APN: ROCK-000010-000000-000058
Disclaimer: Certain information contained herein is derived from information provided by parties other than Homes.com. All information provided is deemed reliable, but is not guaranteed to be accurate and should be independently verified.
![]() The property listing data and information, or the Images, set forth herein were provided to MLS Property Information Network, Inc. from third party sources, including sellers, lessors and public records, and were compiled by MLS Property Information Network, Inc. The property listing data and information, and the Images, are for the personal, non-commercial use of consumers having a good faith interest in purchasing or leasing listed properties of the type displayed to them and may not be used for any purpose other than to identify prospective properties which such consumers may have a good faith interest in purchasing or leasing. MLS Property Information Network, Inc. and its subscribers disclaim any and all representations and warranties as to the accuracy of the property listing data and information, or as to the accuracy of any of the Images, set forth herein.
The property listing data and information, or the Images, set forth herein were provided to MLS Property Information Network, Inc. from third party sources, including sellers, lessors and public records, and were compiled by MLS Property Information Network, Inc. The property listing data and information, and the Images, are for the personal, non-commercial use of consumers having a good faith interest in purchasing or leasing listed properties of the type displayed to them and may not be used for any purpose other than to identify prospective properties which such consumers may have a good faith interest in purchasing or leasing. MLS Property Information Network, Inc. and its subscribers disclaim any and all representations and warranties as to the accuracy of the property listing data and information, or as to the accuracy of any of the Images, set forth herein.
- 55 Turner Rd
- 3 Blueberry Ct
- 120 Deerfield Ln
- 214 Washington St Unit 24
- 214 Washington St Unit 28
- 100 Whiting St
- 80 Coolidge Rd
- 1239 Main St
- 206-208 Hinghm St
- 1088 Main St
- 18 Whiting Ln
- 65 Boxberry Ln
- 7 Boxberry Ln Unit 7
- 375 Webster St
- 1 Kerri Ln
- 79 Tilden Rd
- 4 Richard Rd
- 70 Dillingham Way
- 216 Whiting St
- 354 Webster St
- 66 Gardner St Unit A
- 153 High St
- 15 High St
- 295 Webster St
- 26 Wheeler Ave Unit 1
- 96 Summit St Unit 2
- 96 Summit St Unit 1
- 1362 Washington St
- 1325 Washington St
- 445 Pleasant St Unit 32
- 100 Queen Anne's Dr
- 51 Clubhouse Dr Unit 51
- 198 Reed St Unit 3
- 292 Market St
- 200-220 Trotter Rd
- 10 Patriot Pkwy
- 41 Union St Unit R
- 55 Tall Oaks Dr Unit 407
- 103 Grove St Unit 337
- 80 Mill St
