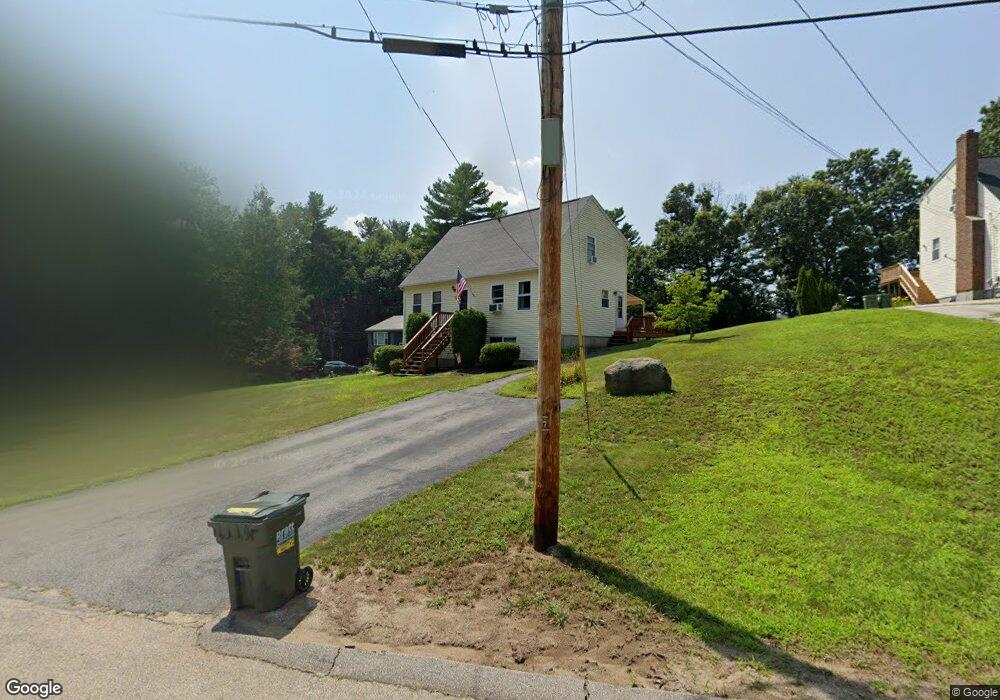
18 Colonial Rd Douglas, MA 01516
Estimated Value: $567,000 - $648,000
4
Beds
2
Baths
1,847
Sq Ft
$322/Sq Ft
Est. Value
About This Home
This home is located at 18 Colonial Rd, Douglas, MA 01516 and is currently estimated at $595,507, approximately $322 per square foot. 18 Colonial Rd is a home located in Worcester County with nearby schools including Douglas Primary School, Douglas Middle School, and Douglas High School.
Ownership History
Date
Name
Owned For
Owner Type
Purchase Details
Closed on
Jun 27, 2002
Sold by
Mank Richard P and Mank Tracey L
Bought by
Bernard Gregory A and Bernard Bonnie J
Current Estimated Value
Home Financials for this Owner
Home Financials are based on the most recent Mortgage that was taken out on this home.
Original Mortgage
$207,900
Interest Rate
6.92%
Mortgage Type
Purchase Money Mortgage
Purchase Details
Closed on
Apr 27, 2001
Sold by
Vadnias Raymond E and Vadnais Dolores M
Bought by
Mank Richard P and Mank Tracey L
Home Financials for this Owner
Home Financials are based on the most recent Mortgage that was taken out on this home.
Original Mortgage
$155,920
Interest Rate
6.88%
Mortgage Type
Purchase Money Mortgage
Purchase Details
Closed on
Feb 28, 1997
Sold by
Harding John M and Harding Sherri L
Bought by
Vadnais Raymond E and Vadnais Dolores M
Purchase Details
Closed on
Feb 5, 1996
Sold by
Kentco Dev Inc
Bought by
Harding John M and Harding Sherri
Create a Home Valuation Report for This Property
The Home Valuation Report is an in-depth analysis detailing your home's value as well as a comparison with similar homes in the area
Home Values in the Area
Average Home Value in this Area
Purchase History
| Date | Buyer | Sale Price | Title Company |
|---|---|---|---|
| Bernard Gregory A | $231,000 | -- | |
| Mank Richard P | $194,900 | -- | |
| Vadnais Raymond E | $137,500 | -- | |
| Harding John M | $127,590 | -- |
Source: Public Records
Mortgage History
| Date | Status | Borrower | Loan Amount |
|---|---|---|---|
| Open | Harding John M | $208,000 | |
| Closed | Harding John M | $207,900 | |
| Previous Owner | Harding John M | $155,920 | |
| Previous Owner | Harding John M | $132,411 |
Source: Public Records
Tax History
| Year | Tax Paid | Tax Assessment Tax Assessment Total Assessment is a certain percentage of the fair market value that is determined by local assessors to be the total taxable value of land and additions on the property. | Land | Improvement |
|---|---|---|---|---|
| 2025 | $60 | $459,000 | $115,500 | $343,500 |
| 2024 | $5,910 | $437,100 | $105,000 | $332,100 |
| 2023 | $5,796 | $403,600 | $105,000 | $298,600 |
| 2022 | $5,557 | $340,100 | $86,800 | $253,300 |
| 2021 | $5,479 | $327,700 | $82,700 | $245,000 |
| 2020 | $6,023 | $315,700 | $82,700 | $233,000 |
| 2019 | $5,198 | $297,000 | $82,700 | $214,300 |
| 2018 | $5,536 | $289,700 | $82,700 | $207,000 |
| 2017 | $4,427 | $264,800 | $80,100 | $184,700 |
| 2016 | $4,306 | $256,000 | $80,100 | $175,900 |
| 2015 | $4,214 | $256,000 | $80,100 | $175,900 |
Source: Public Records
Map
Nearby Homes
- 26 Compass Point Dr Unit 26
- 36 Compass Point Dr Unit 36
- 33 Nautical Way Unit 107
- 22 Gilboa St
- 5 B St
- 8 Hough Rd
- 408 NE Main St
- 2 White Ct
- 41 Martin Rd
- 108 Mumford St
- 80 Barnett Rd
- 4 1st St
- 201 Prescott Rd
- 37 Bayliss Way
- 99 Maple St
- 22 Bayliss Way
- 19 Birch St
- 28 Johnson Rd
- 153 Davis St
- 3 S East Main St
Your Personal Tour Guide
Ask me questions while you tour the home.