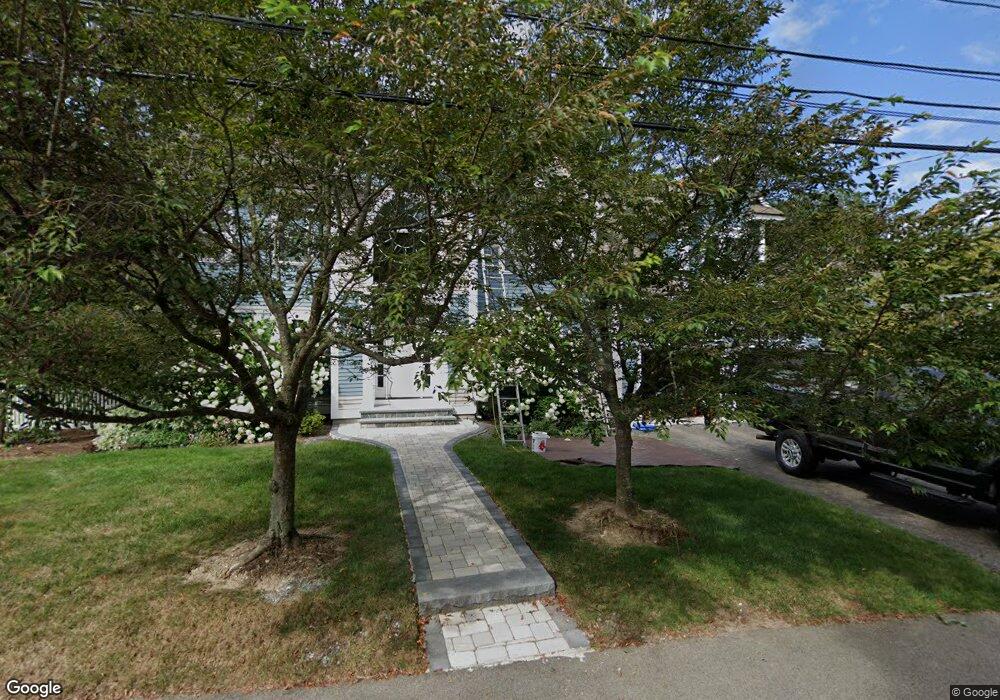
18 Colonial Rd Needham, MA 02492
Estimated Value: $1,947,500
4
Beds
3
Baths
3,377
Sq Ft
$577/Sq Ft
Est. Value
About This Home
This home is located at 18 Colonial Rd, Needham, MA 02492 and is currently estimated at $1,947,500, approximately $576 per square foot. 18 Colonial Rd is a home located in Norfolk County with nearby schools including Newman Elementary School, High Rock Middle School, and Pollard Middle School.
Ownership History
Date
Name
Owned For
Owner Type
Purchase Details
Closed on
Jun 21, 2022
Sold by
Carter David J and Carter Andrea E
Bought by
E Longo Carter T A
Current Estimated Value
Purchase Details
Closed on
Aug 26, 2008
Sold by
Hayes Andrew R and Hayes Dana T
Bought by
Carter Andrea El and Carter David J
Purchase Details
Closed on
Mar 18, 1998
Sold by
Slicken Builder Inc
Bought by
Hayes Andrew R and Hayes Dana T
Purchase Details
Closed on
Jun 23, 1997
Sold by
Reeve Ex Carol H
Bought by
Slicklen Bldrs Inc
Create a Home Valuation Report for This Property
The Home Valuation Report is an in-depth analysis detailing your home's value as well as a comparison with similar homes in the area
Home Values in the Area
Average Home Value in this Area
Purchase History
| Date | Buyer | Sale Price | Title Company |
|---|---|---|---|
| E Longo Carter T A | -- | None Available | |
| E Longo Carter T A | -- | None Available | |
| Carter Andrea El | $1,120,000 | -- | |
| Carter Andrea El | $1,120,000 | -- | |
| Hayes Andrew R | $620,000 | -- | |
| Hayes Andrew R | $620,000 | -- | |
| Slicklen Bldrs Inc | $235,000 | -- | |
| Slicklen Bldrs Inc | $235,000 | -- |
Source: Public Records
Mortgage History
| Date | Status | Borrower | Loan Amount |
|---|---|---|---|
| Previous Owner | Slicklen Bldrs Inc | $510,000 | |
| Previous Owner | Slicklen Bldrs Inc | $516,000 |
Source: Public Records
Tax History
| Year | Tax Paid | Tax Assessment Tax Assessment Total Assessment is a certain percentage of the fair market value that is determined by local assessors to be the total taxable value of land and additions on the property. | Land | Improvement |
|---|---|---|---|---|
| 2025 | $19,074 | $1,799,400 | $798,000 | $1,001,400 |
| 2024 | $16,713 | $1,334,900 | $505,200 | $829,700 |
| 2023 | $16,612 | $1,273,900 | $505,200 | $768,700 |
| 2022 | $15,966 | $1,194,200 | $463,600 | $730,600 |
| 2021 | $15,560 | $1,194,200 | $463,600 | $730,600 |
| 2020 | $15,385 | $1,231,800 | $463,600 | $768,200 |
| 2019 | $14,650 | $1,182,400 | $421,500 | $760,900 |
| 2018 | $14,047 | $1,182,400 | $421,500 | $760,900 |
| 2017 | $12,913 | $1,086,000 | $421,500 | $664,500 |
| 2016 | $12,532 | $1,086,000 | $421,500 | $664,500 |
| 2015 | $12,261 | $1,086,000 | $421,500 | $664,500 |
| 2014 | $11,347 | $974,800 | $366,600 | $608,200 |
Source: Public Records
Map
Nearby Homes
- 620 High Rock St
- 95 Deerfield Rd
- 73 Maple St Unit 1
- 287 High Rock St
- 189 Bridle Trail Rd
- 52 Hancock Rd
- 193 Garden St
- 3 Hancock Rd
- 47 Emerson Rd
- 233 Warren St
- 569 Chestnut St
- 90 Norfolk St
- 21 Brewster Dr
- 19 Highland Ct Unit 19
- 68 Pleasant St Unit 68
- 19 Mason Rd
- 102 Jarvis Cir Unit 102
- 19 Oakland Ave Unit 19
- 37 Carleton Dr
- 37 Standish Rd
- 515 High Rock St
- 28 Colonial Rd
- 521 High Rock St
- 11 Colonial Rd
- 19 Colonial Rd
- 38 Colonial Rd
- 503 High Rock St
- 503 High Rock St Unit To Be Built
- 21 Colonial Rd
- 529 High Rock St
- 25 Colonial Rd
- 516 High Rock St
- 522 High Rock St
- 506 High Rock St
- 44 Colonial Rd
- 530 High Rock St
- 541 High Rock St
- 177 Marked Tree Rd
- 41 Colonial Rd
- 169 Marked Tree Rd
Your Personal Tour Guide
Ask me questions while you tour the home.