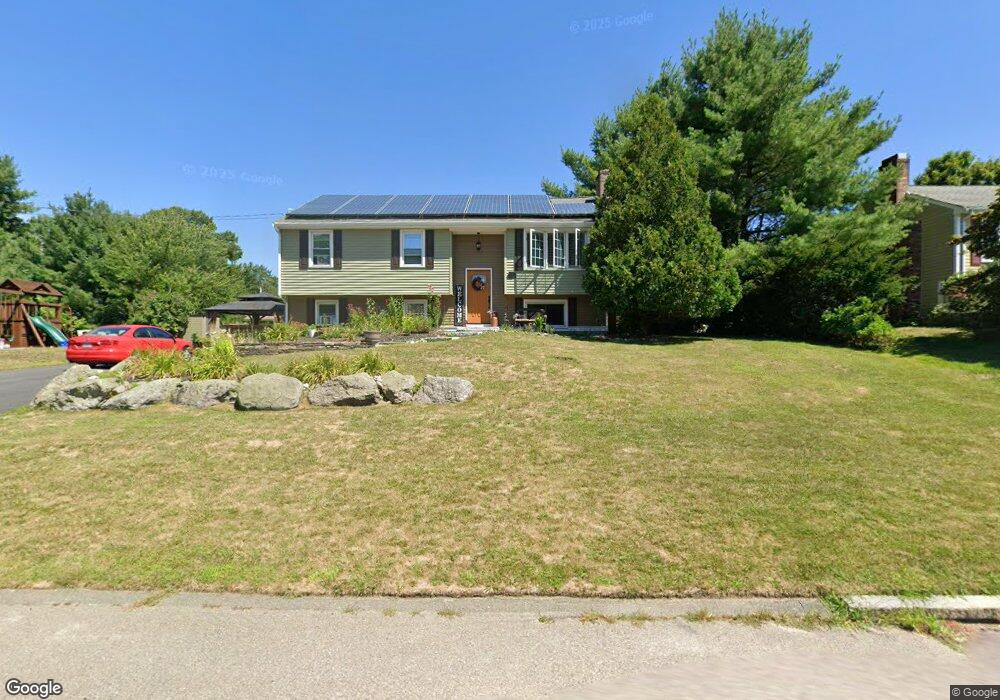
18 Colts Way Attleboro, MA 02703
Estimated Value: $510,315 - $574,000
4
Beds
2
Baths
2,080
Sq Ft
$262/Sq Ft
Est. Value
About This Home
This home is located at 18 Colts Way, Attleboro, MA 02703 and is currently estimated at $545,579, approximately $262 per square foot. 18 Colts Way is a home located in Bristol County with nearby schools including Thomas E. Willett School, Cyril K. Brennan Middle School, and Attleboro High School.
Ownership History
Date
Name
Owned For
Owner Type
Purchase Details
Closed on
May 22, 2014
Sold by
Labire Willaim J and Labrie Kathryn M
Bought by
Ball Eric A and Ball Lori A
Current Estimated Value
Home Financials for this Owner
Home Financials are based on the most recent Mortgage that was taken out on this home.
Original Mortgage
$256,000
Outstanding Balance
$195,102
Interest Rate
4.33%
Mortgage Type
New Conventional
Estimated Equity
$350,477
Purchase Details
Closed on
Oct 31, 1996
Sold by
Awad Osama M and Awad Nagwa M
Bought by
Labrie William J and Labrie Kathryn M
Create a Home Valuation Report for This Property
The Home Valuation Report is an in-depth analysis detailing your home's value as well as a comparison with similar homes in the area
Home Values in the Area
Average Home Value in this Area
Purchase History
| Date | Buyer | Sale Price | Title Company |
|---|---|---|---|
| Ball Eric A | $256,000 | -- | |
| Labrie William J | $137,500 | -- |
Source: Public Records
Mortgage History
| Date | Status | Borrower | Loan Amount |
|---|---|---|---|
| Open | Ball Eric A | $256,000 | |
| Previous Owner | Labrie William J | $177,750 | |
| Previous Owner | Labrie William J | $35,550 |
Source: Public Records
Tax History Compared to Growth
Tax History
| Year | Tax Paid | Tax Assessment Tax Assessment Total Assessment is a certain percentage of the fair market value that is determined by local assessors to be the total taxable value of land and additions on the property. | Land | Improvement |
|---|---|---|---|---|
| 2025 | $5,846 | $465,800 | $167,900 | $297,900 |
| 2024 | $5,616 | $441,200 | $151,100 | $290,100 |
| 2023 | $5,475 | $399,900 | $152,500 | $247,400 |
| 2022 | $5,216 | $361,000 | $145,500 | $215,500 |
| 2021 | $4,877 | $329,500 | $140,000 | $189,500 |
| 2020 | $4,579 | $314,500 | $133,700 | $180,800 |
| 2019 | $4,334 | $306,100 | $131,300 | $174,800 |
| 2018 | $4,141 | $279,400 | $127,200 | $152,200 |
| 2017 | $3,991 | $274,300 | $123,900 | $150,400 |
| 2016 | $3,837 | $258,900 | $115,700 | $143,200 |
| 2015 | $3,786 | $257,400 | $115,700 | $141,700 |
| 2014 | $3,631 | $244,500 | $110,700 | $133,800 |
Source: Public Records
Map
Nearby Homes