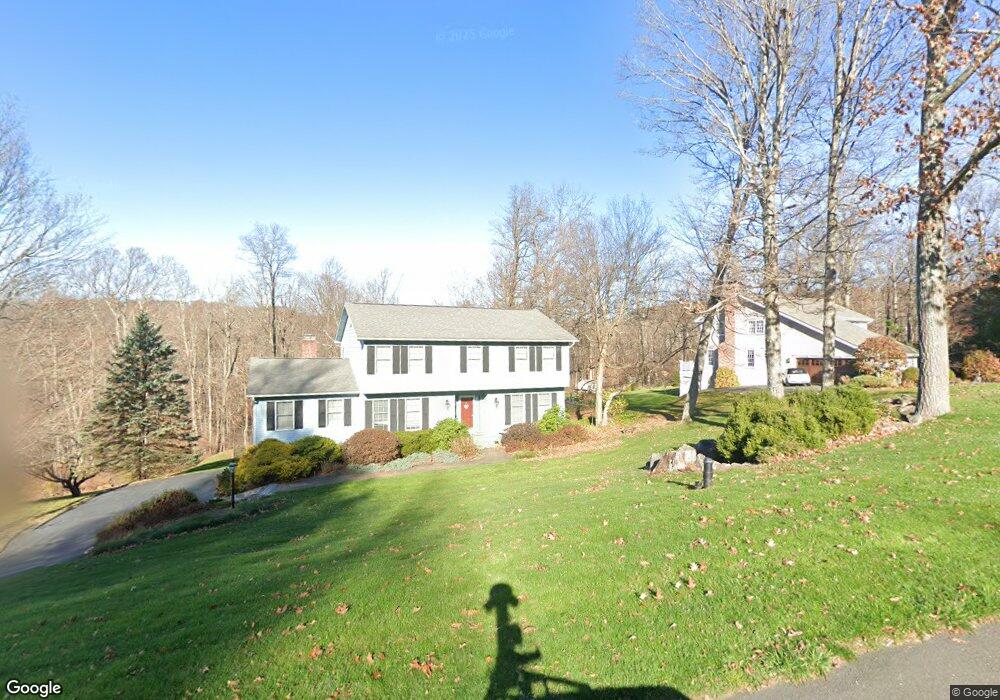
18 Columbia Dr New Fairfield, CT 06812
Estimated Value: $692,000 - $953,000
4
Beds
3
Baths
2,576
Sq Ft
$311/Sq Ft
Est. Value
About This Home
This home is located at 18 Columbia Dr, New Fairfield, CT 06812 and is currently estimated at $800,967, approximately $310 per square foot. 18 Columbia Dr is a home located in Fairfield County with nearby schools including Meeting House Hill School, New Fairfield Middle School, and New Fairfield High School.
Ownership History
Date
Name
Owned For
Owner Type
Purchase Details
Closed on
Jan 17, 1996
Sold by
Babcock Howard and Babcock Kathleen
Bought by
Mannion Thomas P and Mannion Mary A
Current Estimated Value
Home Financials for this Owner
Home Financials are based on the most recent Mortgage that was taken out on this home.
Original Mortgage
$203,000
Interest Rate
7.16%
Mortgage Type
Unknown
Purchase Details
Closed on
Jul 16, 1992
Sold by
Flynn Michele
Bought by
Babcock Howard C and Babcock Kathleen
Purchase Details
Closed on
Apr 10, 1990
Sold by
Twilley Charles
Bought by
Flynn John
Create a Home Valuation Report for This Property
The Home Valuation Report is an in-depth analysis detailing your home's value as well as a comparison with similar homes in the area
Home Values in the Area
Average Home Value in this Area
Purchase History
| Date | Buyer | Sale Price | Title Company |
|---|---|---|---|
| Mannion Thomas P | $280,000 | -- | |
| Babcock Howard C | $270,000 | -- | |
| Flynn John | $295,000 | -- |
Source: Public Records
Mortgage History
| Date | Status | Borrower | Loan Amount |
|---|---|---|---|
| Closed | Flynn John | $20,000 | |
| Closed | Flynn John | $176,927 | |
| Closed | Flynn John | $199,500 | |
| Closed | Flynn John | $203,000 |
Source: Public Records
Tax History Compared to Growth
Tax History
| Year | Tax Paid | Tax Assessment Tax Assessment Total Assessment is a certain percentage of the fair market value that is determined by local assessors to be the total taxable value of land and additions on the property. | Land | Improvement |
|---|---|---|---|---|
| 2025 | $10,853 | $412,200 | $126,300 | $285,900 |
| 2024 | $10,503 | $287,600 | $114,700 | $172,900 |
| 2023 | $10,037 | $287,600 | $114,700 | $172,900 |
| 2022 | $9,338 | $287,600 | $114,700 | $172,900 |
| 2021 | $9,057 | $287,600 | $114,700 | $172,900 |
| 2020 | $8,795 | $287,600 | $114,700 | $172,900 |
| 2019 | $8,726 | $282,400 | $121,000 | $161,400 |
| 2018 | $8,636 | $282,400 | $121,000 | $161,400 |
| 2017 | $8,421 | $282,400 | $121,000 | $161,400 |
| 2016 | $8,099 | $282,400 | $121,000 | $161,400 |
| 2015 | $8,099 | $282,400 | $121,000 | $161,400 |
| 2014 | $8,353 | $320,300 | $137,700 | $182,600 |
Source: Public Records
Map
Nearby Homes