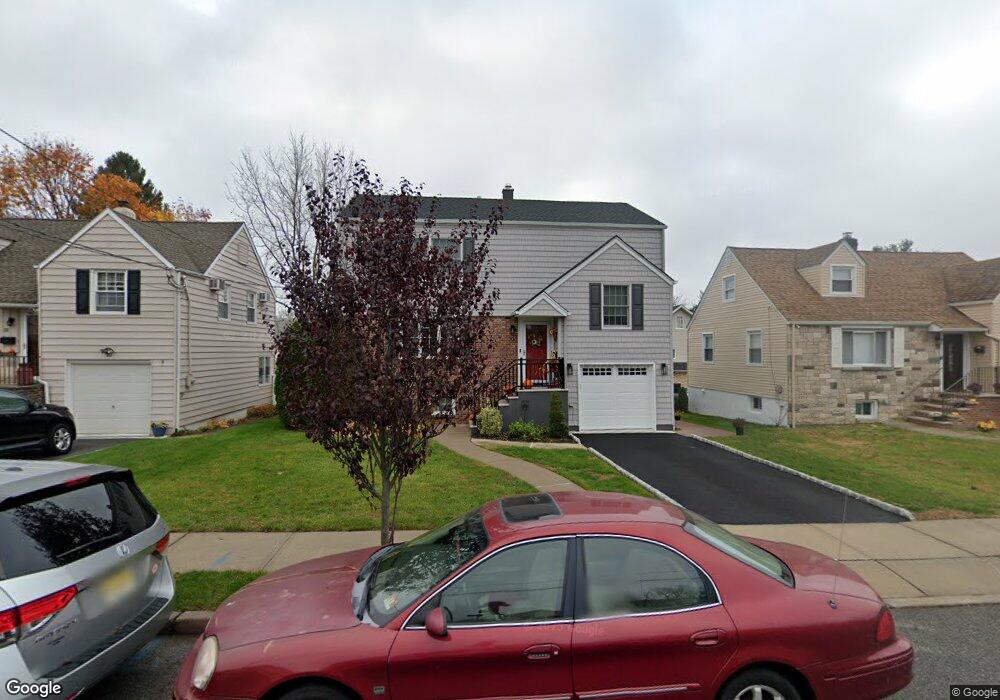
18 Concord St Clifton, NJ 07013
Albion NeighborhoodEstimated Value: $602,000 - $790,000
--
Bed
--
Bath
2,090
Sq Ft
$321/Sq Ft
Est. Value
About This Home
This home is located at 18 Concord St, Clifton, NJ 07013 and is currently estimated at $671,301, approximately $321 per square foot. 18 Concord St is a home located in Passaic County with nearby schools including Clifton High School.
Ownership History
Date
Name
Owned For
Owner Type
Purchase Details
Closed on
Aug 18, 2005
Sold by
Basilicato Suzanne A
Bought by
Rodriguez Israel
Current Estimated Value
Home Financials for this Owner
Home Financials are based on the most recent Mortgage that was taken out on this home.
Original Mortgage
$296,000
Outstanding Balance
$155,692
Interest Rate
5.68%
Estimated Equity
$515,609
Purchase Details
Closed on
Oct 31, 2001
Sold by
Mcallister Ruth
Bought by
Basilicato Suzanne
Home Financials for this Owner
Home Financials are based on the most recent Mortgage that was taken out on this home.
Original Mortgage
$35,000
Interest Rate
6.6%
Create a Home Valuation Report for This Property
The Home Valuation Report is an in-depth analysis detailing your home's value as well as a comparison with similar homes in the area
Home Values in the Area
Average Home Value in this Area
Purchase History
| Date | Buyer | Sale Price | Title Company |
|---|---|---|---|
| Rodriguez Israel | $370,000 | -- | |
| Basilicato Suzanne | $215,000 | -- |
Source: Public Records
Mortgage History
| Date | Status | Borrower | Loan Amount |
|---|---|---|---|
| Open | Rodriguez Israel | $296,000 | |
| Previous Owner | Basilicato Suzanne | $35,000 |
Source: Public Records
Tax History Compared to Growth
Tax History
| Year | Tax Paid | Tax Assessment Tax Assessment Total Assessment is a certain percentage of the fair market value that is determined by local assessors to be the total taxable value of land and additions on the property. | Land | Improvement |
|---|---|---|---|---|
| 2025 | $12,958 | $218,300 | $92,500 | $125,800 |
| 2024 | $12,648 | $218,300 | $92,500 | $125,800 |
| 2022 | $12,465 | $218,300 | $92,500 | $125,800 |
| 2021 | $9,559 | $174,600 | $92,500 | $82,100 |
| 2020 | $9,591 | $174,600 | $92,500 | $82,100 |
| 2019 | $9,523 | $174,600 | $92,500 | $82,100 |
| 2018 | $9,469 | $174,600 | $92,500 | $82,100 |
| 2017 | $9,366 | $174,600 | $92,500 | $82,100 |
| 2016 | $9,184 | $174,600 | $92,500 | $82,100 |
| 2015 | $9,095 | $174,600 | $92,500 | $82,100 |
| 2014 | $8,908 | $174,600 | $92,500 | $82,100 |
Source: Public Records
Map
Nearby Homes