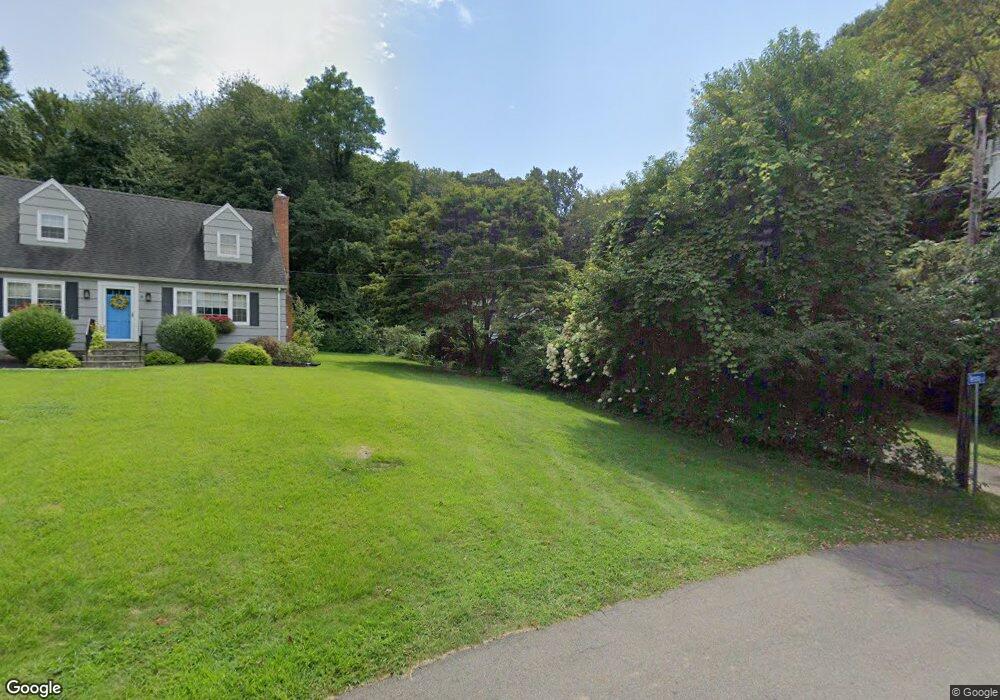
18 Conklin Ave Ivoryton, CT 06442
Estimated Value: $361,000 - $517,000
3
Beds
2
Baths
1,360
Sq Ft
$328/Sq Ft
Est. Value
About This Home
This home is located at 18 Conklin Ave, Ivoryton, CT 06442 and is currently estimated at $446,740, approximately $328 per square foot. 18 Conklin Ave is a home located in Middlesex County with nearby schools including Valley Regional High School.
Ownership History
Date
Name
Owned For
Owner Type
Purchase Details
Closed on
Oct 25, 2024
Sold by
Senn Ethel S
Bought by
Schumacher Aron D and Schumacher Danielle R
Current Estimated Value
Home Financials for this Owner
Home Financials are based on the most recent Mortgage that was taken out on this home.
Original Mortgage
$316,000
Outstanding Balance
$312,511
Interest Rate
6.09%
Mortgage Type
Purchase Money Mortgage
Estimated Equity
$134,229
Purchase Details
Closed on
Jun 21, 1965
Bought by
Senn John H and Senn Ethel S
Create a Home Valuation Report for This Property
The Home Valuation Report is an in-depth analysis detailing your home's value as well as a comparison with similar homes in the area
Home Values in the Area
Average Home Value in this Area
Purchase History
We collect this data history from publicly available records. To have your information removed, we recommend requesting removal directly through your county’s website.
| Date | Buyer | Sale Price | Title Company |
|---|---|---|---|
| Schumacher Aron D | $395,000 | None Available | |
| Schumacher Aron D | $395,000 | None Available | |
| Senn John H | -- | -- |
Source: Public Records
Mortgage History
We collect this data history from publicly available records. To have your information removed, we recommend requesting removal directly through your county’s website.
| Date | Status | Borrower | Loan Amount |
|---|---|---|---|
| Open | Schumacher Aron D | $316,000 | |
| Closed | Schumacher Aron D | $316,000 | |
| Previous Owner | Senn John H | $110,000 | |
| Previous Owner | Senn John H | $109,000 | |
| Previous Owner | Senn John H | $99,900 |
Source: Public Records
Tax History
| Year | Tax Paid | Tax Assessment Tax Assessment Total Assessment is a certain percentage of the fair market value that is determined by local assessors to be the total taxable value of land and additions on the property. | Land | Improvement |
|---|---|---|---|---|
| 2025 | $4,965 | $266,500 | $64,600 | $201,900 |
| 2024 | $4,810 | $266,500 | $64,600 | $201,900 |
| 2023 | $3,852 | $170,500 | $57,300 | $113,200 |
| 2022 | $3,862 | $170,500 | $57,300 | $113,200 |
| 2021 | $3,824 | $170,500 | $57,300 | $113,200 |
| 2020 | $3,719 | $170,500 | $57,300 | $113,200 |
| 2019 | $3,691 | $170,500 | $57,300 | $113,200 |
| 2018 | $3,439 | $157,400 | $60,300 | $97,100 |
| 2017 | $3,457 | $157,400 | $60,300 | $97,100 |
| 2016 | $3,397 | $157,400 | $60,300 | $97,100 |
| 2015 | $3,318 | $157,400 | $60,300 | $97,100 |
| 2014 | $3,304 | $157,400 | $60,300 | $97,100 |
Source: Public Records
Map
Nearby Homes
- 45 Falls River Dr
- 88 Main St
- 112 Main St
- 130 Mares Hill Rd
- 7 Mitchel Terrace
- 108 Westbrook Rd
- 27 Birch Mill Trail
- 33 Deep River Rd
- 199 Westbrook Rd
- 36 Highland Terrace
- 22 Ebony Ln
- 193 Main St
- 52 Pond Meadow Rd
- 9 Brooks Ln
- 14 Essex Glen Dr Unit 4
- 14 Essex Glen Dr Unit 9
- 41 Bushy Hill Rd
- 7 Orchard Heights Rd
- 86 Bushy Hill Rd
- 16 Primrose Ledge
Your Personal Tour Guide
Ask me questions while you tour the home.