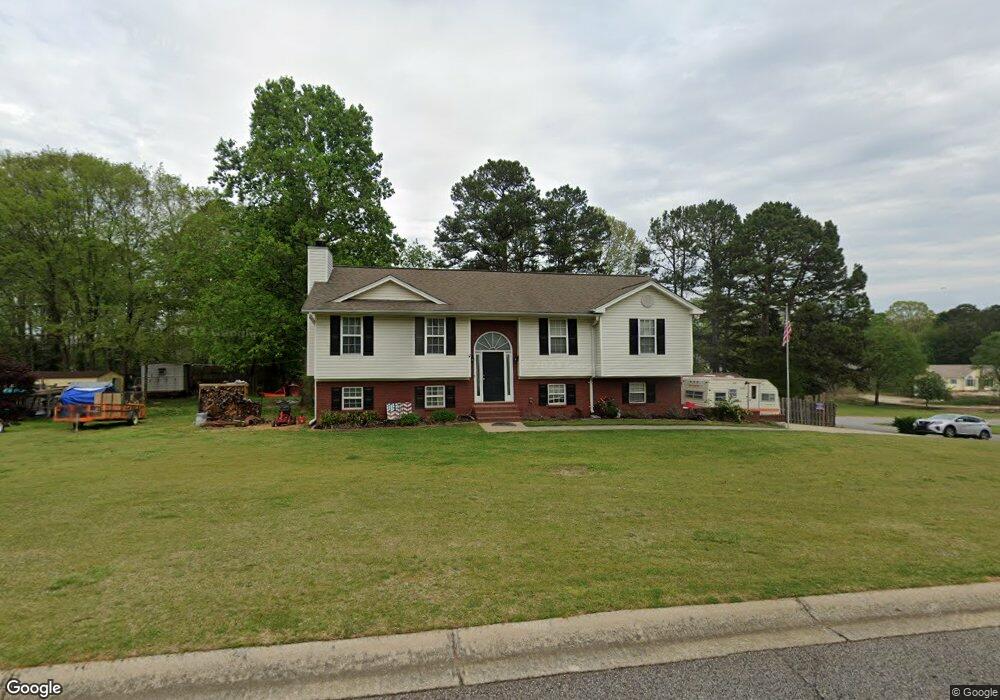
18 Creek View Dr Hoschton, GA 30548
Estimated Value: $365,000 - $396,000
--
Bed
2
Baths
2,062
Sq Ft
$182/Sq Ft
Est. Value
About This Home
This home is located at 18 Creek View Dr, Hoschton, GA 30548 and is currently estimated at $376,232, approximately $182 per square foot. 18 Creek View Dr is a home located in Jackson County with nearby schools including Gum Springs Elementary School, West Jackson Middle School, and Jackson County High School.
Ownership History
Date
Name
Owned For
Owner Type
Purchase Details
Closed on
Jun 26, 2017
Sold by
Holder Mark
Bought by
Holder Mark and Holder Evelyn A
Current Estimated Value
Home Financials for this Owner
Home Financials are based on the most recent Mortgage that was taken out on this home.
Original Mortgage
$122,412
Outstanding Balance
$101,871
Interest Rate
3.95%
Mortgage Type
New Conventional
Estimated Equity
$274,361
Purchase Details
Closed on
Sep 7, 2005
Sold by
Mtg Electronic Registratio
Bought by
Household Realty Corp
Purchase Details
Closed on
Sep 23, 2004
Sold by
Mortgage Electronic Registration Systems
Bought by
Household Realty Corporation
Purchase Details
Closed on
Sep 20, 2004
Sold by
Mortgage Electronic Reg Sys
Bought by
Holder Mark
Purchase Details
Closed on
Jun 1, 2004
Sold by
Hawkins Jeffrey Mich
Bought by
Mortgage Electronic Reg Sys
Purchase Details
Closed on
Oct 25, 2000
Sold by
Butler Wendell
Bought by
Hawkins Jeffrey Mich
Purchase Details
Closed on
Jul 29, 1999
Bought by
Butler Wendell
Create a Home Valuation Report for This Property
The Home Valuation Report is an in-depth analysis detailing your home's value as well as a comparison with similar homes in the area
Home Values in the Area
Average Home Value in this Area
Purchase History
| Date | Buyer | Sale Price | Title Company |
|---|---|---|---|
| Holder Mark | -- | -- | |
| Household Realty Corp | -- | -- | |
| Household Realty Corporation | -- | -- | |
| Holder Mark | $132,000 | -- | |
| Mortgage Electronic Reg Sys | -- | -- | |
| Hawkins Jeffrey Mich | $129,900 | -- | |
| Butler Wendell | $15,000 | -- |
Source: Public Records
Mortgage History
| Date | Status | Borrower | Loan Amount |
|---|---|---|---|
| Open | Holder Mark | $122,412 |
Source: Public Records
Tax History Compared to Growth
Tax History
| Year | Tax Paid | Tax Assessment Tax Assessment Total Assessment is a certain percentage of the fair market value that is determined by local assessors to be the total taxable value of land and additions on the property. | Land | Improvement |
|---|---|---|---|---|
| 2024 | $2,435 | $102,120 | $24,000 | $78,120 |
| 2023 | $2,435 | $92,960 | $24,000 | $68,960 |
| 2022 | $2,070 | $76,320 | $24,000 | $52,320 |
| 2021 | $1,916 | $70,280 | $17,960 | $52,320 |
| 2020 | $1,670 | $56,160 | $11,840 | $44,320 |
| 2019 | $1,696 | $56,160 | $11,840 | $44,320 |
| 2018 | $1,652 | $54,000 | $11,840 | $42,160 |
| 2017 | $1,647 | $53,336 | $11,840 | $41,496 |
| 2016 | $1,656 | $53,336 | $11,840 | $41,496 |
| 2015 | $1,412 | $45,520 | $6,000 | $39,520 |
| 2014 | $1,390 | $44,528 | $6,000 | $38,528 |
| 2013 | -- | $41,060 | $6,000 | $35,060 |
Source: Public Records
Map
Nearby Homes
- 516 Stone Creek Dr
- 58 Creek View Dr
- 0 Stone Creek Dr Unit 3268208
- 0 Stone Creek Dr
- 125 Stone Creek Dr
- 27 Creek View Dr
- 88 Stone Creek Dr
- 55 Creek View Dr
- 136 Stone Creek Dr
- 82 Creek View Dr
- 41 Stone Creek Dr
- 81 Creek View Dr
- 40 Stone Creek Dr
- 267 Stone View Dr
- 245 Stoneview Dr
- 245 Stone View Dr
- 51 Plum Ct
- 114 Creek View Dr
- 191 Stone View Dr
- 3384 Highway 332