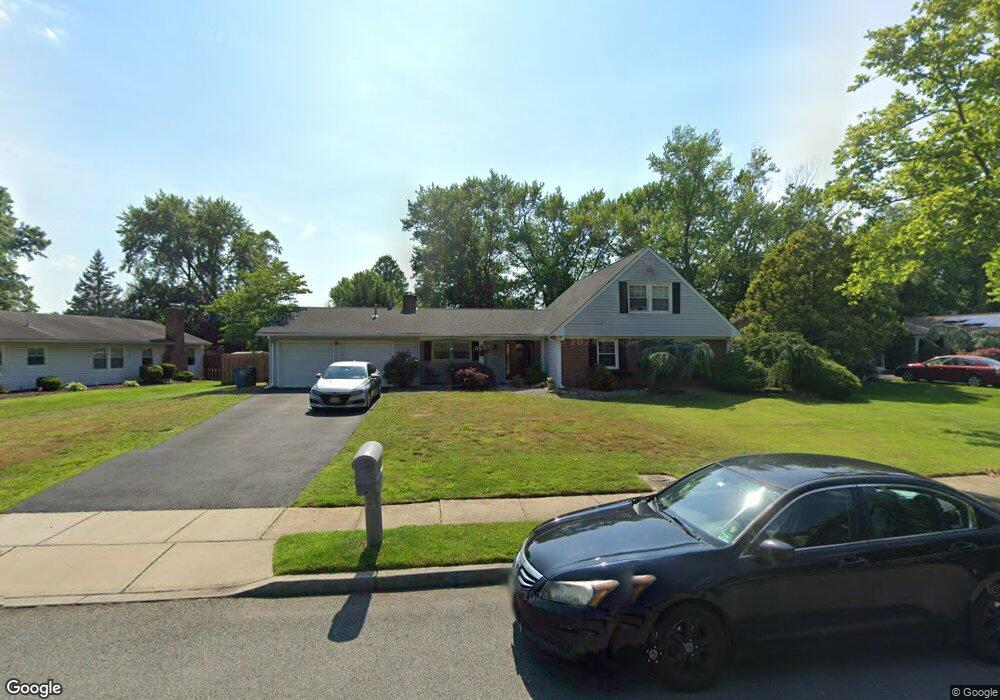
18 Cressida Dr Old Bridge, NJ 08857
Estimated Value: $686,486 - $852,000
Studio
--
Bath
2,323
Sq Ft
$329/Sq Ft
Est. Value
About This Home
This home is located at 18 Cressida Dr, Old Bridge, NJ 08857 and is currently estimated at $765,122, approximately $329 per square foot. 18 Cressida Dr is a home located in Middlesex County with nearby schools including Old Bridge High School, St. Ambrose School, and Minding Miracles Learning Center.
Ownership History
Date
Name
Owned For
Owner Type
Purchase Details
Closed on
Feb 16, 2001
Current Estimated Value
Purchase Details
Closed on
Dec 15, 2000
Sold by
Handler John
Bought by
Laconti Robert
Home Financials for this Owner
Home Financials are based on the most recent Mortgage that was taken out on this home.
Original Mortgage
$185,000
Interest Rate
7.69%
Create a Home Valuation Report for This Property
The Home Valuation Report is an in-depth analysis detailing your home's value as well as a comparison with similar homes in the area
Home Values in the Area
Average Home Value in this Area
Purchase History
| Date | Buyer | Sale Price | Title Company |
|---|---|---|---|
| -- | -- | -- | |
| Laconti Robert | $235,000 | -- |
Source: Public Records
Mortgage History
| Date | Status | Borrower | Loan Amount |
|---|---|---|---|
| Previous Owner | Laconti Robert | $185,000 |
Source: Public Records
Tax History
| Year | Tax Paid | Tax Assessment Tax Assessment Total Assessment is a certain percentage of the fair market value that is determined by local assessors to be the total taxable value of land and additions on the property. | Land | Improvement |
|---|---|---|---|---|
| 2025 | $9,769 | $173,000 | $61,100 | $111,900 |
| 2024 | $9,371 | $173,000 | $61,100 | $111,900 |
| 2023 | $9,371 | $173,000 | $61,100 | $111,900 |
| 2022 | $9,157 | $173,000 | $61,100 | $111,900 |
| 2021 | $6,721 | $173,000 | $61,100 | $111,900 |
| 2020 | $8,887 | $173,000 | $61,100 | $111,900 |
| 2019 | $8,737 | $173,000 | $61,100 | $111,900 |
| 2018 | $8,640 | $173,000 | $61,100 | $111,900 |
| 2017 | $8,359 | $173,000 | $61,100 | $111,900 |
| 2016 | $8,186 | $173,000 | $61,100 | $111,900 |
| 2015 | $8,045 | $173,000 | $61,100 | $111,900 |
| 2014 | $7,963 | $173,000 | $61,100 | $111,900 |
Source: Public Records
Map
Nearby Homes
Your Personal Tour Guide
Ask me questions while you tour the home.