Estimated Value: $189,368 - $241,000
--
Bed
3
Baths
1,381
Sq Ft
$156/Sq Ft
Est. Value
About This Home
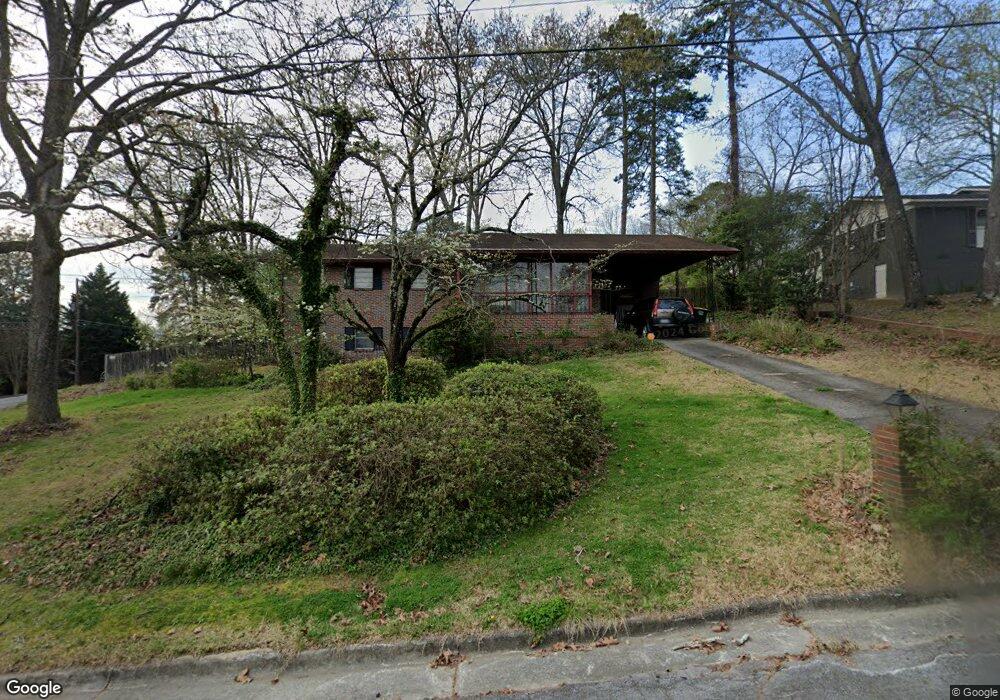
This home is located at 18 Crestridge Dr SW, Rome, GA 30165 and is currently estimated at $216,092, approximately $156 per square foot. 18 Crestridge Dr SW is a home located in Floyd County with nearby schools including Rome High School.
Ownership History
Date
Name
Owned For
Owner Type
Purchase Details
Closed on
Aug 22, 2003
Sold by
Dill Sheilah B
Bought by
Dill Sheilah G and Dill John B
Current Estimated Value
Purchase Details
Closed on
Apr 25, 1994
Sold by
Smith Evans Lumber Company
Bought by
Dill Sheilah B
Purchase Details
Closed on
Mar 1, 1994
Sold by
Leithauser Don G and Mervin Gould
Bought by
Smith Evans Lumber Company
Purchase Details
Closed on
Sep 12, 1991
Sold by
Vaughn Archie G and Vaughn Marie V
Bought by
Leithauser Don G and Mervin Gould
Purchase Details
Closed on
Feb 16, 1988
Sold by
Jones Ralph L and Jones Sibyl H
Bought by
Vaughn Archie G and Vaughn Marie V
Purchase Details
Closed on
Mar 9, 1979
Sold by
Driscoll Donald J and Driscoll Sandra M
Bought by
Jones Ralph L and Jones Sibyl H
Purchase Details
Closed on
Apr 26, 1977
Sold by
Buffington J Doyle
Bought by
Driscoll Donald J and Driscoll Sandra M
Purchase Details
Closed on
Apr 6, 1972
Sold by
Fitchett J Calvin
Bought by
Buffington J Doyle
Purchase Details
Closed on
Jun 14, 1969
Sold by
Johnston Jimmy F
Bought by
Fitchett J Calvin
Purchase Details
Closed on
Jan 1, 1901
Bought by
Johnston Jimmy F
Create a Home Valuation Report for This Property
The Home Valuation Report is an in-depth analysis detailing your home's value as well as a comparison with similar homes in the area
Home Values in the Area
Average Home Value in this Area
Purchase History
| Date | Buyer | Sale Price | Title Company |
|---|---|---|---|
| Dill Sheilah G | -- | -- | |
| Dill Sheilah B | $65,000 | -- | |
| Smith Evans Lumber Company | $19,500 | -- | |
| Leithauser Don G | $70,000 | -- | |
| Vaughn Archie G | $66,000 | -- | |
| Jones Ralph L | $43,400 | -- | |
| Driscoll Donald J | $42,900 | -- | |
| Buffington J Doyle | $21,000 | -- | |
| Fitchett J Calvin | -- | -- | |
| Johnston Jimmy F | -- | -- |
Source: Public Records
Tax History Compared to Growth
Tax History
| Year | Tax Paid | Tax Assessment Tax Assessment Total Assessment is a certain percentage of the fair market value that is determined by local assessors to be the total taxable value of land and additions on the property. | Land | Improvement |
|---|---|---|---|---|
| 2024 | $776 | $72,512 | $15,356 | $57,156 |
| 2023 | $748 | $65,756 | $13,870 | $51,886 |
| 2022 | $786 | $54,667 | $11,393 | $43,274 |
| 2021 | $803 | $50,362 | $11,393 | $38,969 |
| 2020 | $911 | $45,485 | $8,669 | $36,816 |
| 2019 | $858 | $43,332 | $8,669 | $34,663 |
| 2018 | $779 | $41,180 | $8,669 | $32,511 |
| 2017 | $733 | $39,869 | $8,669 | $31,200 |
| 2016 | $643 | $35,080 | $8,640 | $26,440 |
| 2015 | $575 | $35,080 | $8,640 | $26,440 |
| 2014 | $575 | $35,438 | $8,640 | $26,798 |
Source: Public Records
Map
Nearby Homes
- 0 Westlyn Dr Unit 10599621
- 0 Westlyn Dr Unit 7645405
- 1 Westlyn Dr SW
- 108 Deerbrook Dr SW
- 30 Westover Dr SW
- 9 Ladonna Place SW
- 15 Ladonna Place SW
- 3 Lovell Ln SW
- 25 Ridge Dr SW
- 3 Oak Ridge Ct NE
- 200 Coosawattee Ave SW
- 216 Coosawattee Ave SW
- 106 Kenwood Dr SW
- 10 Thornwood Dr SW
- 106 Melody Ln NW
- 15 John Ross Dr SW
- 52 Glenda Dr SW
- 2604 Shorter Ave NW
- 118 Melody Ln NW
- 203 Hycliff Rd SW
- 202 Coker Dr SW
- 16 Crestridge Dr SW
- 110 Coker Dr SW
- 27 Westlyn Dr SW
- 14 Crestridge Dr Drsw
- 204 Coker Dr SW
- 4 Westover Dr SW
- 14 Crestridge Dr SW
- 118 Brentwood Dr SW
- 115 Coker Dr SW
- 11 Crestridge Dr SW
- 108 Coker Dr SW
- 25 Westlyn Dr SW
- 113 Coker Dr SW
- 6 Westover Dr SW
- 12 Crestridge Dr SW
- 116 Brentwood Dr SW
- 9 Crestridge Dr SW
- 22 Westlyn Dr SW
- 201 Coker Dr SW