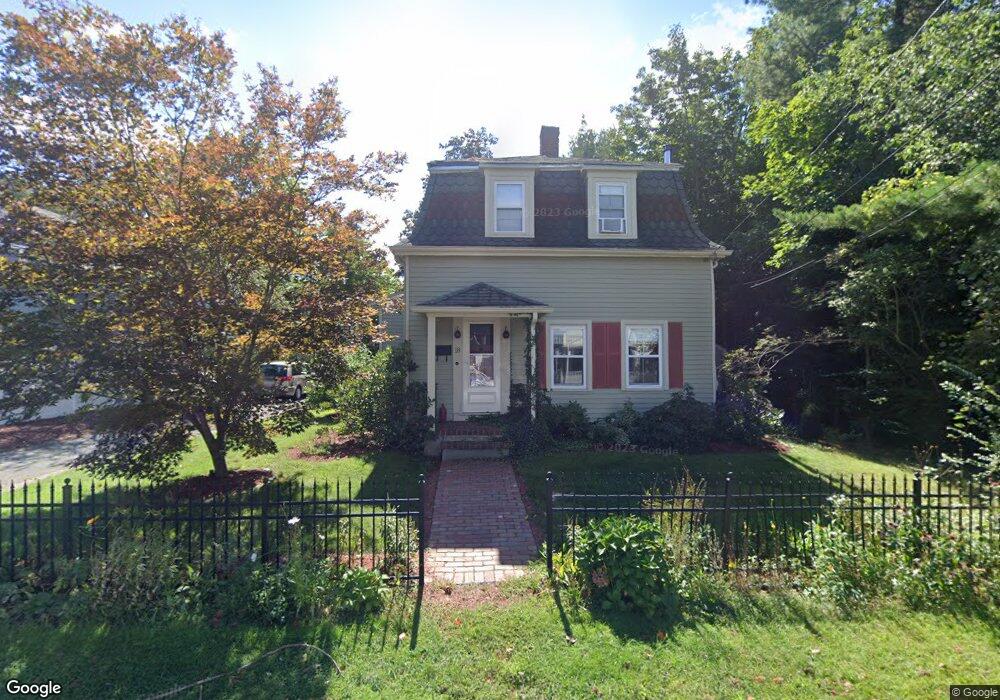
18 Curve St Natick, MA 01760
Estimated Value: $962,000 - $1,088,000
2
Beds
3
Baths
2,200
Sq Ft
$457/Sq Ft
Est. Value
About This Home
This home is located at 18 Curve St, Natick, MA 01760 and is currently estimated at $1,004,367, approximately $456 per square foot. 18 Curve St is a home located in Middlesex County with nearby schools including Natick High School, Johnson Elementary School, and J F Kennedy Middle School.
Ownership History
Date
Name
Owned For
Owner Type
Purchase Details
Closed on
Jul 8, 1998
Sold by
Cipollone Vincent M
Bought by
Pedrelli Mark E and Pedrelli Robin A
Current Estimated Value
Home Financials for this Owner
Home Financials are based on the most recent Mortgage that was taken out on this home.
Original Mortgage
$172,400
Outstanding Balance
$35,342
Interest Rate
7.02%
Mortgage Type
Purchase Money Mortgage
Estimated Equity
$969,025
Purchase Details
Closed on
Aug 23, 1996
Sold by
Rooney John P and Rooney Rebecca
Bought by
Cipollone Vincent M
Purchase Details
Closed on
May 13, 1994
Sold by
Smith William J and Smith Laurie F
Bought by
Rooney John P and Rooney Rebecca
Purchase Details
Closed on
Mar 10, 1988
Sold by
Bellofatto Anthony
Bought by
Smith William J
Create a Home Valuation Report for This Property
The Home Valuation Report is an in-depth analysis detailing your home's value as well as a comparison with similar homes in the area
Home Values in the Area
Average Home Value in this Area
Purchase History
| Date | Buyer | Sale Price | Title Company |
|---|---|---|---|
| Pedrelli Mark E | $215,500 | -- | |
| Cipollone Vincent M | $173,000 | -- | |
| Rooney John P | $163,500 | -- | |
| Smith William J | $175,000 | -- |
Source: Public Records
Mortgage History
| Date | Status | Borrower | Loan Amount |
|---|---|---|---|
| Open | Smith William J | $172,400 | |
| Previous Owner | Smith William J | $151,000 | |
| Previous Owner | Smith William J | $155,000 |
Source: Public Records
Tax History Compared to Growth
Tax History
| Year | Tax Paid | Tax Assessment Tax Assessment Total Assessment is a certain percentage of the fair market value that is determined by local assessors to be the total taxable value of land and additions on the property. | Land | Improvement |
|---|---|---|---|---|
| 2025 | $10,000 | $836,100 | $465,100 | $371,000 |
| 2024 | $9,620 | $784,700 | $439,300 | $345,400 |
| 2023 | $9,098 | $719,800 | $412,100 | $307,700 |
| 2022 | $8,754 | $656,200 | $374,800 | $281,400 |
| 2021 | $5,672 | $618,000 | $354,300 | $263,700 |
| 2020 | $0 | $587,100 | $323,400 | $263,700 |
| 2019 | $0 | $587,100 | $323,400 | $263,700 |
| 2018 | $7,876 | $603,500 | $308,000 | $295,500 |
| 2017 | $7,625 | $565,200 | $275,100 | $290,100 |
| 2016 | $7,430 | $547,500 | $260,100 | $287,400 |
| 2015 | $7,232 | $523,300 | $260,100 | $263,200 |
Source: Public Records
Map
Nearby Homes
- 47 High St
- 25 Forest Ave
- 8 Floral Avenue Extension
- 20 Walcott St
- 6 Ambler Ct
- 8 Floral Ave Unit 8
- 8 Pitts St
- 216-218 S Main St
- 16 West St
- 58 W Central St
- 48 S Main St Unit 7
- 49 Summer St
- 15 Church St Unit 3
- 11 Avon St
- 6B Lincoln St Unit 6B
- 4B Lincoln St Unit 4B
- 5 Wilson St Unit 5A
- 3 Wilson St Unit 3B
- 34 N Main St Unit 2
- 2 Yuba Place