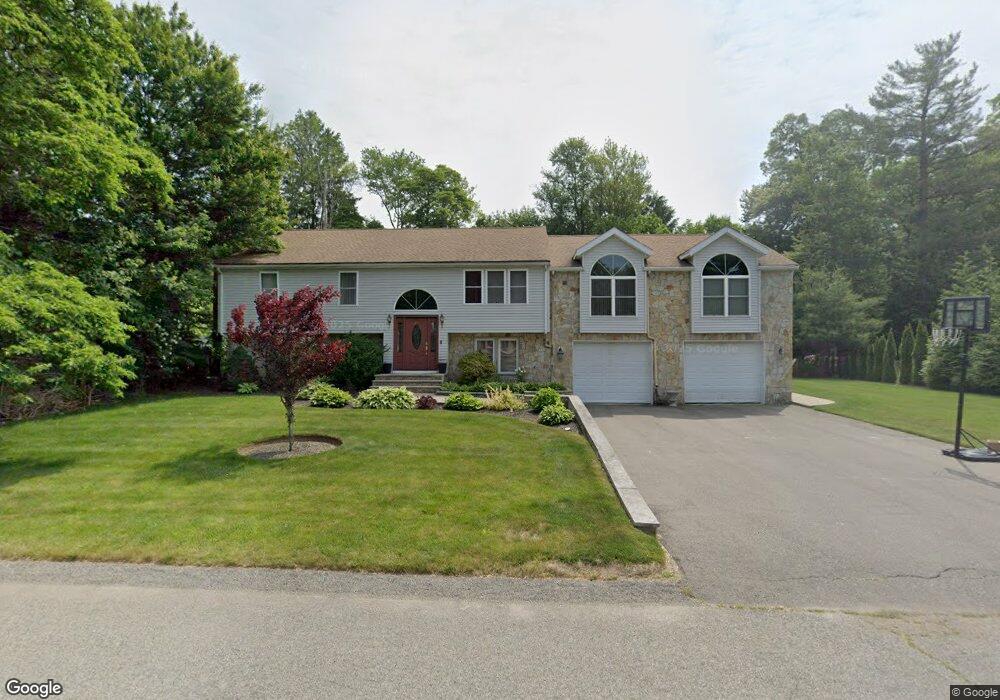
18 Cushing Rd Brockton, MA 02302
Estimated Value: $603,000 - $660,000
3
Beds
2
Baths
2,590
Sq Ft
$244/Sq Ft
Est. Value
About This Home
This home is located at 18 Cushing Rd, Brockton, MA 02302 and is currently estimated at $632,676, approximately $244 per square foot. 18 Cushing Rd is a home located in Plymouth County with nearby schools including Gilmore Elementary School, Davis K-8 School, and John F. Kennedy Elementary School.
Ownership History
Date
Name
Owned For
Owner Type
Purchase Details
Closed on
Aug 5, 1999
Sold by
Burton Rt
Bought by
Rodrigues Tony A and Rodrigues Danina L
Current Estimated Value
Home Financials for this Owner
Home Financials are based on the most recent Mortgage that was taken out on this home.
Original Mortgage
$129,244
Interest Rate
7.54%
Mortgage Type
Purchase Money Mortgage
Purchase Details
Closed on
Dec 22, 1998
Sold by
Christ Werner
Bought by
Burton Rt
Create a Home Valuation Report for This Property
The Home Valuation Report is an in-depth analysis detailing your home's value as well as a comparison with similar homes in the area
Purchase History
| Date | Buyer | Sale Price | Title Company |
|---|---|---|---|
| Rodrigues Tony A | $158,000 | -- | |
| Burton Rt | $25,000 | -- |
Source: Public Records
Mortgage History
| Date | Status | Borrower | Loan Amount |
|---|---|---|---|
| Open | Burton Rt | $191,900 | |
| Closed | Burton Rt | $170,000 | |
| Closed | Burton Rt | $129,244 |
Source: Public Records
Tax History
| Year | Tax Paid | Tax Assessment Tax Assessment Total Assessment is a certain percentage of the fair market value that is determined by local assessors to be the total taxable value of land and additions on the property. | Land | Improvement |
|---|---|---|---|---|
| 2025 | $7,056 | $582,700 | $168,300 | $414,400 |
| 2024 | $6,557 | $545,500 | $168,300 | $377,200 |
| 2023 | $6,356 | $489,700 | $119,400 | $370,300 |
| 2022 | $5,894 | $421,900 | $108,500 | $313,400 |
| 2021 | $5,906 | $407,300 | $100,700 | $306,600 |
| 2020 | $5,951 | $392,800 | $87,700 | $305,100 |
| 2019 | $5,498 | $353,800 | $84,200 | $269,600 |
| 2018 | $5,272 | $328,300 | $84,200 | $244,100 |
| 2017 | $4,985 | $309,600 | $84,200 | $225,400 |
| 2016 | $5,461 | $314,600 | $80,400 | $234,200 |
| 2015 | $5,249 | $289,200 | $80,400 | $208,800 |
| 2014 | $4,984 | $274,900 | $80,400 | $194,500 |
Source: Public Records
Map
Nearby Homes
- 578 Plain St
- 1 Thomas Cir
- 23 Dondi Rd
- 118 Deanna Rd
- 15 Wachusetts Rd
- 463 Pleasant St
- 12 Paulin Ave
- 31 Friendship Dr
- 16 Liberty St
- 18 American Ave
- 10 Colleen Way
- 16 Jason Way
- 549 Summer St
- 55 Marjan Dr
- 9 Longworth Ave Unit 135
- 9 Longworth Ave Unit 113
- 15 Longworth Ave Unit 226
- 25 Longworth Ave Unit 4
- 35 Longworth Ave Unit 25
- 323 Matfield St
Your Personal Tour Guide
Ask me questions while you tour the home.