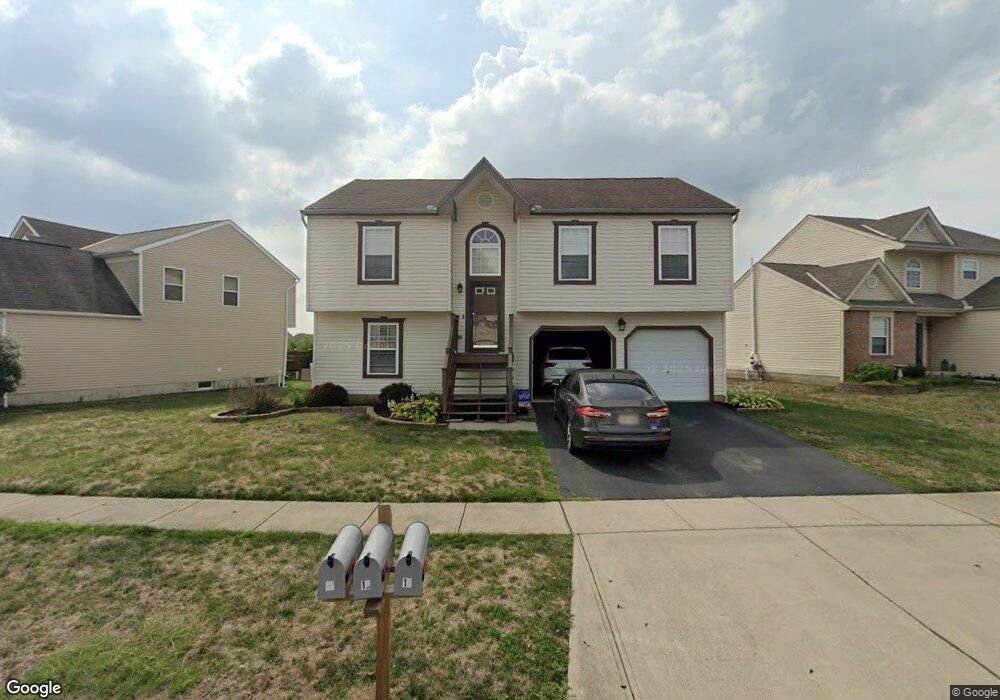
18 Danielson Cir Unit 9 South Bloomfield, OH 43103
Estimated Value: $312,000 - $351,000
3
Beds
3
Baths
1,268
Sq Ft
$259/Sq Ft
Est. Value
About This Home
This home is located at 18 Danielson Cir Unit 9, South Bloomfield, OH 43103 and is currently estimated at $328,624, approximately $259 per square foot. 18 Danielson Cir Unit 9 is a home located in Pickaway County.
Ownership History
Date
Name
Owned For
Owner Type
Purchase Details
Closed on
Jul 24, 2015
Sold by
Carty Mindy M and Anderson Ryan
Bought by
Sheets Bobbie J and Sheets Brent S
Current Estimated Value
Home Financials for this Owner
Home Financials are based on the most recent Mortgage that was taken out on this home.
Original Mortgage
$140,409
Outstanding Balance
$111,872
Interest Rate
4.5%
Mortgage Type
FHA
Estimated Equity
$216,752
Purchase Details
Closed on
Aug 28, 2009
Sold by
Federal Home Loan Mortgage Corporation
Bought by
Carty Mindy M
Home Financials for this Owner
Home Financials are based on the most recent Mortgage that was taken out on this home.
Original Mortgage
$123,000
Interest Rate
5.38%
Mortgage Type
New Conventional
Purchase Details
Closed on
Aug 19, 2009
Sold by
Wilson Rebecca M
Bought by
Federal Home Loan Mortgage Corp
Home Financials for this Owner
Home Financials are based on the most recent Mortgage that was taken out on this home.
Original Mortgage
$123,000
Interest Rate
5.38%
Mortgage Type
New Conventional
Purchase Details
Closed on
Jul 15, 2005
Sold by
Maronda Homes Inc Of Ohio
Bought by
Wilson Jeffry L and Wilson Rebecca M
Home Financials for this Owner
Home Financials are based on the most recent Mortgage that was taken out on this home.
Original Mortgage
$119,000
Interest Rate
5.68%
Mortgage Type
Fannie Mae Freddie Mac
Create a Home Valuation Report for This Property
The Home Valuation Report is an in-depth analysis detailing your home's value as well as a comparison with similar homes in the area
Home Values in the Area
Average Home Value in this Area
Purchase History
| Date | Buyer | Sale Price | Title Company |
|---|---|---|---|
| Sheets Bobbie J | $143,000 | Transcounty Title | |
| Carty Mindy M | $117,800 | None Available | |
| Federal Home Loan Mortgage Corp | $77,334 | None Available | |
| Wilson Jeffry L | $139,000 | Stewart Title |
Source: Public Records
Mortgage History
| Date | Status | Borrower | Loan Amount |
|---|---|---|---|
| Open | Sheets Bobbie J | $140,409 | |
| Previous Owner | Carty Mindy M | $123,000 | |
| Previous Owner | Wilson Jeffry L | $119,000 |
Source: Public Records
Tax History Compared to Growth
Tax History
| Year | Tax Paid | Tax Assessment Tax Assessment Total Assessment is a certain percentage of the fair market value that is determined by local assessors to be the total taxable value of land and additions on the property. | Land | Improvement |
|---|---|---|---|---|
| 2024 | -- | $81,420 | $6,100 | $75,320 |
| 2023 | $3,122 | $81,420 | $6,100 | $75,320 |
| 2022 | $2,471 | $59,370 | $5,120 | $54,250 |
| 2021 | $2,340 | $59,370 | $5,120 | $54,250 |
| 2020 | $2,346 | $59,370 | $5,120 | $54,250 |
| 2019 | $1,873 | $50,240 | $5,120 | $45,120 |
| 2018 | $2,071 | $50,240 | $5,120 | $45,120 |
| 2017 | $2,125 | $50,240 | $5,120 | $45,120 |
| 2016 | $1,663 | $39,150 | $5,100 | $34,050 |
| 2015 | $1,709 | $39,150 | $5,100 | $34,050 |
| 2014 | $1,710 | $39,150 | $5,100 | $34,050 |
| 2013 | $1,770 | $39,150 | $5,100 | $34,050 |
Source: Public Records
Map
Nearby Homes
- The Daffodil Plan at Riverbend at Scioto Landing
- The Daisy Plan at Riverbend at Scioto Landing
- The Avalon Plan at Riverbend at Scioto Landing
- The Aster Plan at Riverbend at Scioto Landing
- 0 U S 23
- 51 Henderson Ln
- 5050 S Walnut St
- 127 Boutot St
- Longwood Plan at Walker Pointe
- Birmingham Plan at Walker Pointe
- Sanibel Plan at Walker Pointe
- Carlisle Plan at Walker Pointe
- Somerset Plan at Walker Pointe
- Chattanooga Plan at Walker Pointe
- Rockford Plan at Walker Pointe
- Hoover Plan at Walker Pointe
- Sedona Plan at Walker Pointe
- Truman Plan at Walker Pointe
- Miramar Plan at Walker Pointe
- 5332 Karst Cir
- 18 Danielson Cir
- 16 Danielson Cir
- 16 Danielson Cir Unit 8
- 20 Danielson Cir
- 14 Danielson Cir
- 22 Danielson Cir Unit 11
- 22 Danielson Cir
- 12 Danielson Cir
- 17 Danielson Cir
- 19 Danielson Cir
- 15 Danielson Cir
- 15 Danielson Cir Unit 41
- 21 Danielson Cir
- 13 Danielson Cir
- 13 Danielson Cir Unit 40
- 23 Danielson Cir
- 23 Danielson Cir Unit 45
- 10 Danielson Cir
- 10 Danielson Cir Unit 5
- 11 Danielson Cir