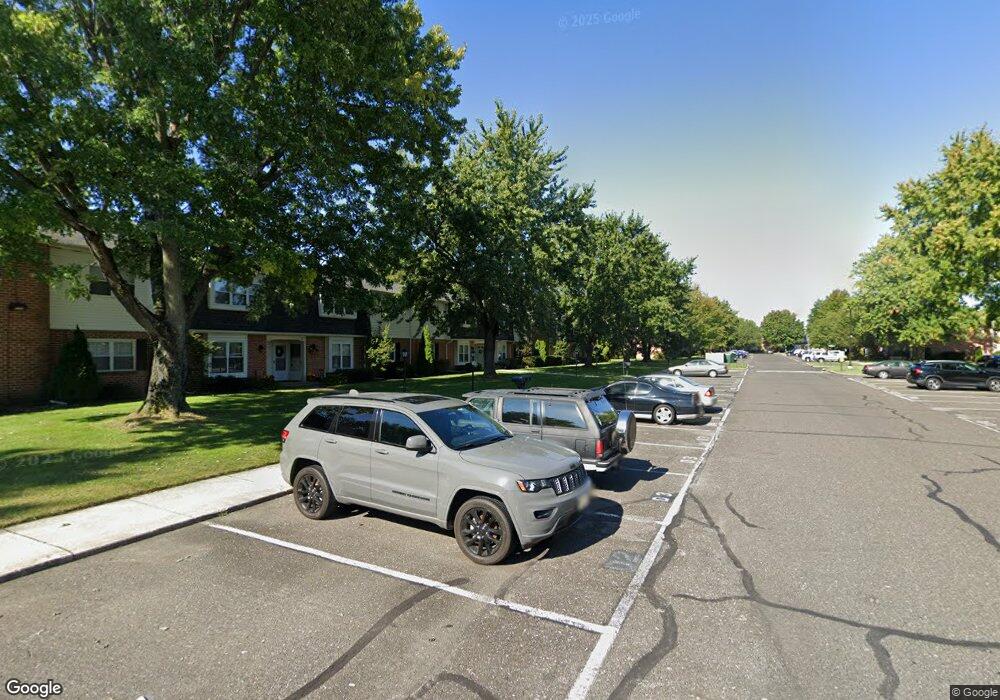
18 Deborah Ln Unit 18 Hammonton, NJ 08037
Estimated Value: $209,466 - $219,000
2
Beds
1
Bath
1,014
Sq Ft
$211/Sq Ft
Est. Value
About This Home
This home is located at 18 Deborah Ln Unit 18, Hammonton, NJ 08037 and is currently estimated at $213,867, approximately $210 per square foot. 18 Deborah Ln Unit 18 is a home located in Atlantic County with nearby schools including Hammonton Early Childhood Education Center, Warren E. Sooy Jr. Elementary School, and Hammonton Middle School.
Ownership History
Date
Name
Owned For
Owner Type
Purchase Details
Closed on
Feb 23, 2018
Sold by
Penza Stella E and Reustle Albert
Bought by
Stella E Penza Inter Vivos Irrevocable T
Current Estimated Value
Purchase Details
Closed on
Jun 29, 2017
Sold by
Schleyer Christopher E and Schleyer Agnieszka A
Bought by
Penza Stella E and Reustle Sharon
Home Financials for this Owner
Home Financials are based on the most recent Mortgage that was taken out on this home.
Original Mortgage
$107,350
Outstanding Balance
$89,190
Interest Rate
3.89%
Mortgage Type
New Conventional
Estimated Equity
$124,677
Purchase Details
Closed on
Apr 23, 2004
Sold by
Haeser Kenneth R and Haeser Tabitha
Bought by
Schleyer Christopher E and Schleyer Agnieszka A
Create a Home Valuation Report for This Property
The Home Valuation Report is an in-depth analysis detailing your home's value as well as a comparison with similar homes in the area
Home Values in the Area
Average Home Value in this Area
Purchase History
| Date | Buyer | Sale Price | Title Company |
|---|---|---|---|
| Stella E Penza Inter Vivos Irrevocable T | -- | None Available | |
| Penza Stella E | $130,000 | City Abstract Llc | |
| Schleyer Christopher E | $78,000 | Landis Title Corporation |
Source: Public Records
Mortgage History
| Date | Status | Borrower | Loan Amount |
|---|---|---|---|
| Open | Penza Stella E | $107,350 |
Source: Public Records
Tax History Compared to Growth
Tax History
| Year | Tax Paid | Tax Assessment Tax Assessment Total Assessment is a certain percentage of the fair market value that is determined by local assessors to be the total taxable value of land and additions on the property. | Land | Improvement |
|---|---|---|---|---|
| 2025 | $2,903 | $105,500 | $30,000 | $75,500 |
| 2024 | $2,903 | $105,500 | $30,000 | $75,500 |
| 2023 | $2,873 | $105,500 | $30,000 | $75,500 |
| 2022 | $2,873 | $105,500 | $30,000 | $75,500 |
| 2021 | $2,883 | $105,500 | $30,000 | $75,500 |
| 2020 | $2,869 | $105,500 | $30,000 | $75,500 |
| 2019 | $2,858 | $105,500 | $30,000 | $75,500 |
| 2018 | $2,844 | $105,500 | $30,000 | $75,500 |
| 2017 | $2,804 | $105,500 | $30,000 | $75,500 |
| 2016 | $2,702 | $105,500 | $30,000 | $75,500 |
| 2015 | $2,623 | $105,500 | $30,000 | $75,500 |
| 2014 | $2,656 | $71,600 | $27,000 | $44,600 |
Source: Public Records
Map
Nearby Homes
- 18 Deborah Ln Unit 18U
- 20 Deborah Ln
- 20 Deborah Ln
- 21 Deborah Ln Unit D
- 21 Deborah Ln Unit 21U
- 21 Deborah Ln
- 21 Deborah Ln
- 22U Deborah Ln
- 22 Deborah Ln
- 22 Deborah Ln
- 14U Rose Rita Terrace
- 29 Rose Rita Terrace Unit 29-U
- 9 Rose Rita Terrace Unit U
- 38U Rose Rita Terrace Unit 38U
- 37 Rose Rita Terrace Unit 37U
- 35 Rose Rita Terrace
- 34U Rose Rita Terrace
- 33U Rose Rita Terrace Unit 33U
- 32U Rose Rita Terrace
- 31 Rose Rita Terrace Unit 31U