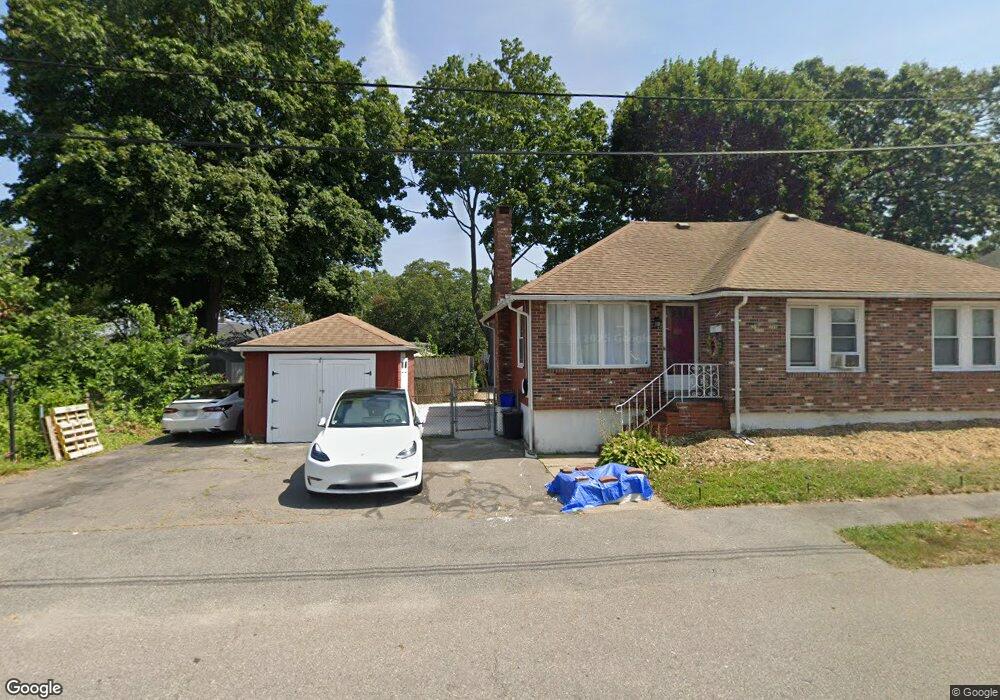
18 Delano Ave Quincy, MA 02169
Adams Shore NeighborhoodEstimated Value: $605,000 - $711,000
2
Beds
3
Baths
1,376
Sq Ft
$479/Sq Ft
Est. Value
About This Home
This home is located at 18 Delano Ave, Quincy, MA 02169 and is currently estimated at $658,590, approximately $478 per square foot. 18 Delano Ave is a home located in Norfolk County with nearby schools including Merrymount Elementary School, Broad Meadows Middle School, and Quincy High School.
Ownership History
Date
Name
Owned For
Owner Type
Purchase Details
Closed on
Nov 10, 2020
Sold by
Andrew David F
Bought by
Andrew Ft and Dipietro
Current Estimated Value
Purchase Details
Closed on
Jun 8, 1998
Sold by
Andrew David and Andrew Paul
Bought by
Andrew David and Andrew Nancy C
Home Financials for this Owner
Home Financials are based on the most recent Mortgage that was taken out on this home.
Original Mortgage
$48,063
Interest Rate
7.11%
Create a Home Valuation Report for This Property
The Home Valuation Report is an in-depth analysis detailing your home's value as well as a comparison with similar homes in the area
Home Values in the Area
Average Home Value in this Area
Purchase History
| Date | Buyer | Sale Price | Title Company |
|---|---|---|---|
| Andrew Ft | -- | None Available | |
| Andrew David | $6,827 | -- |
Source: Public Records
Mortgage History
| Date | Status | Borrower | Loan Amount |
|---|---|---|---|
| Previous Owner | Andrew David | $48,063 | |
| Previous Owner | Andrew David | $102,950 |
Source: Public Records
Tax History
| Year | Tax Paid | Tax Assessment Tax Assessment Total Assessment is a certain percentage of the fair market value that is determined by local assessors to be the total taxable value of land and additions on the property. | Land | Improvement |
|---|---|---|---|---|
| 2025 | $6,785 | $588,500 | $319,300 | $269,200 |
| 2024 | $6,049 | $536,700 | $310,000 | $226,700 |
| 2023 | $5,672 | $509,600 | $269,600 | $240,000 |
| 2022 | $5,802 | $484,300 | $245,100 | $239,200 |
| 2021 | $5,604 | $461,600 | $245,100 | $216,500 |
| 2020 | $5,432 | $437,000 | $235,600 | $201,400 |
| 2019 | $5,270 | $419,900 | $220,200 | $199,700 |
| 2018 | $4,974 | $372,900 | $191,500 | $181,400 |
| 2017 | $4,968 | $350,600 | $191,500 | $159,100 |
| 2016 | $4,878 | $339,700 | $191,500 | $148,200 |
| 2015 | $4,621 | $316,500 | $180,600 | $135,900 |
| 2014 | $4,407 | $296,600 | $172,100 | $124,500 |
Source: Public Records
Map
Nearby Homes
- 36 Palmer St
- 503 Sea St
- 479 Sea St Unit 2
- 96 Utica St
- 599 Sea St Unit 2
- 599 Sea St Unit 1
- 9 Poplar Rd
- 162 Palmer St
- 10 Forbush Ave
- 25 Moffat Rd
- 59 Terne Rd
- 245 Sea St Unit 45
- 107 Baxter Ave
- 50 Harrison St
- 21 Curtis Ave
- 40 Virginia Rd
- 386 Washington St Unit 1
- 388 Washington St Unit 302
- 388 Washington St Unit 301
- 388 Washington St Unit 205
Your Personal Tour Guide
Ask me questions while you tour the home.