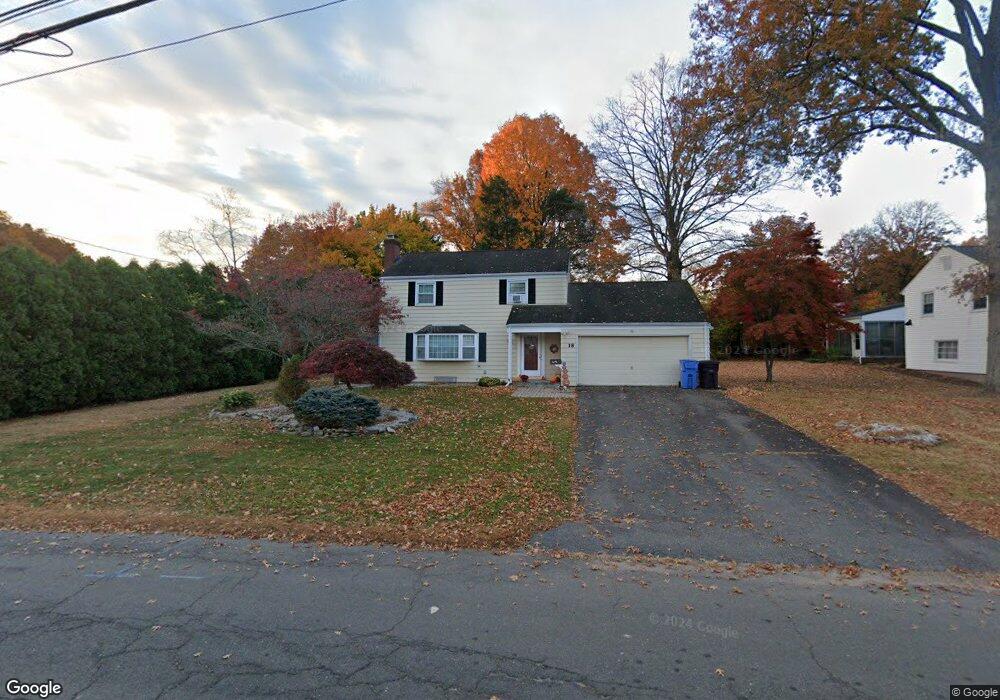
18 Dorset Rd New Britain, CT 06052
Estimated Value: $345,000 - $380,000
3
Beds
2
Baths
1,700
Sq Ft
$214/Sq Ft
Est. Value
About This Home
This home is located at 18 Dorset Rd, New Britain, CT 06052 and is currently estimated at $363,238, approximately $213 per square foot. 18 Dorset Rd is a home located in Hartford County with nearby schools including Vance School, Slade Middle School, and St Paul School.
Ownership History
Date
Name
Owned For
Owner Type
Purchase Details
Closed on
Jul 2, 2021
Sold by
Davis Carol A
Bought by
Carol A Davis Ft
Current Estimated Value
Purchase Details
Closed on
Jul 29, 1997
Sold by
Francini Mark E and Francini Pamela S
Bought by
Davis Bert E
Purchase Details
Closed on
Nov 9, 1989
Sold by
Levenstein Harry
Bought by
Anyzeski John
Create a Home Valuation Report for This Property
The Home Valuation Report is an in-depth analysis detailing your home's value as well as a comparison with similar homes in the area
Home Values in the Area
Average Home Value in this Area
Purchase History
| Date | Buyer | Sale Price | Title Company |
|---|---|---|---|
| Carol A Davis Ft | -- | None Available | |
| Davis Bert E | $118,000 | -- | |
| Anyzeski John | $152,000 | -- |
Source: Public Records
Mortgage History
| Date | Status | Borrower | Loan Amount |
|---|---|---|---|
| Previous Owner | Anyzeski John | $118,000 | |
| Previous Owner | Anyzeski John | $98,000 | |
| Previous Owner | Anyzeski John | $99,000 |
Source: Public Records
Tax History Compared to Growth
Tax History
| Year | Tax Paid | Tax Assessment Tax Assessment Total Assessment is a certain percentage of the fair market value that is determined by local assessors to be the total taxable value of land and additions on the property. | Land | Improvement |
|---|---|---|---|---|
| 2025 | $6,966 | $177,800 | $58,240 | $119,560 |
| 2024 | $7,039 | $177,800 | $58,240 | $119,560 |
| 2023 | $6,806 | $177,800 | $58,240 | $119,560 |
| 2022 | $5,811 | $117,390 | $26,810 | $90,580 |
| 2021 | $5,811 | $117,390 | $26,810 | $90,580 |
| 2020 | $5,928 | $117,390 | $26,810 | $90,580 |
| 2019 | $5,928 | $117,390 | $26,810 | $90,580 |
| 2018 | $5,928 | $117,390 | $26,810 | $90,580 |
| 2017 | $5,985 | $118,510 | $27,370 | $91,140 |
| 2016 | $5,985 | $118,510 | $27,370 | $91,140 |
| 2015 | $5,807 | $118,510 | $27,370 | $91,140 |
| 2014 | $5,807 | $118,510 | $27,370 | $91,140 |
Source: Public Records
Map
Nearby Homes
- 62 Cedarwood Rd
- 565 Lincoln St
- 305 Lincoln St
- 73 Brooklawn St
- 100 Shuttle Meadow Ave
- 30 Norden St
- 17 Kensington Ave
- 82 Pond St
- 266 Farmington Ave
- 423 Monroe St
- 300 Lincoln St
- 70 Monroe St
- 256 Hart St
- 93 Winthrop St
- 212 Lincoln St
- 217 Newton St
- 78 Victoria Rd
- 21 Trinity St Unit 23
- 0 Chamberlain Hwy
- 44 Brook St