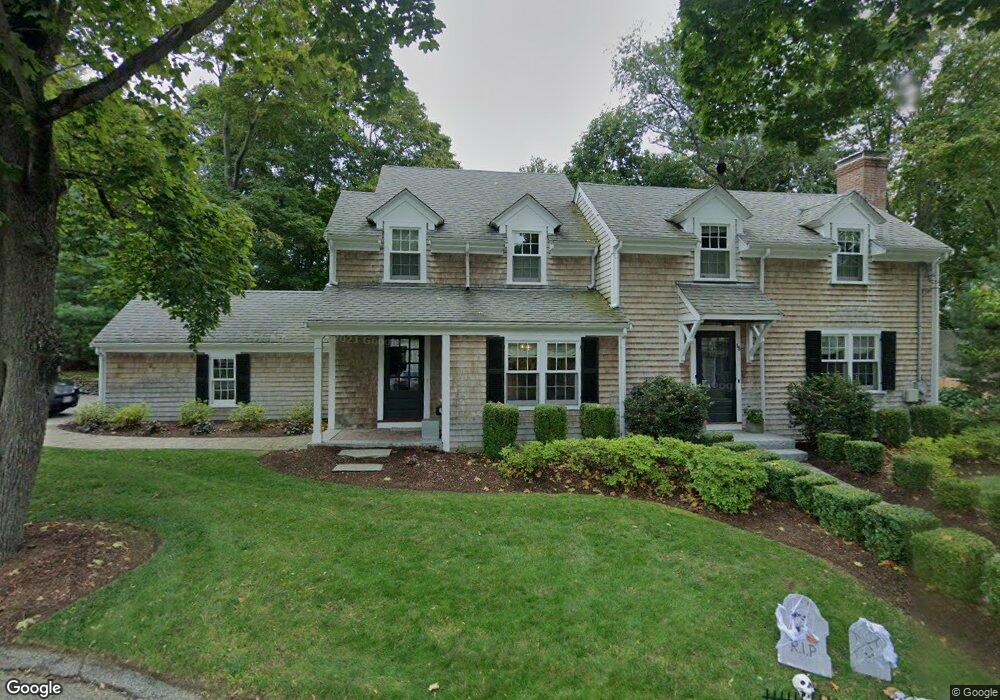
18 Downing St Hingham, MA 02043
Estimated Value: $1,533,000 - $1,881,000
4
Beds
3
Baths
2,750
Sq Ft
$630/Sq Ft
Est. Value
About This Home
This home is located at 18 Downing St, Hingham, MA 02043 and is currently estimated at $1,731,975, approximately $629 per square foot. 18 Downing St is a home located in Plymouth County with nearby schools including East Elementary School, Hingham Middle School, and Hingham High School.
Ownership History
Date
Name
Owned For
Owner Type
Purchase Details
Closed on
Oct 8, 2010
Sold by
Day Kathleen A
Bought by
Newth Sean and Newth Katharine
Current Estimated Value
Home Financials for this Owner
Home Financials are based on the most recent Mortgage that was taken out on this home.
Original Mortgage
$676,000
Outstanding Balance
$446,542
Interest Rate
4.37%
Mortgage Type
Purchase Money Mortgage
Estimated Equity
$1,285,433
Purchase Details
Closed on
Jan 28, 2008
Sold by
Day Ft and Day Kathleen A
Bought by
Day Kathleen A
Purchase Details
Closed on
Sep 6, 2007
Sold by
Whelehan Timothy F and Whelehan Heather H
Bought by
Day Tr Kathleen A and Burke William F
Purchase Details
Closed on
Aug 26, 2005
Sold by
Hardey Deborah A
Bought by
Whelehan Timothy F and Whelehan Heather H
Purchase Details
Closed on
Sep 29, 1999
Sold by
Moore Virginia H
Bought by
Hardey Thomas I and Hardey Deborah A
Create a Home Valuation Report for This Property
The Home Valuation Report is an in-depth analysis detailing your home's value as well as a comparison with similar homes in the area
Purchase History
| Date | Buyer | Sale Price | Title Company |
|---|---|---|---|
| Newth Sean | $845,000 | -- | |
| Day Kathleen A | -- | -- | |
| Day Tr Kathleen A | $675,000 | -- | |
| Whelehan Timothy F | $539,000 | -- | |
| Hardey Thomas I | $300,000 | -- |
Source: Public Records
Mortgage History
| Date | Status | Borrower | Loan Amount |
|---|---|---|---|
| Open | Newth Sean | $676,000 | |
| Previous Owner | Hardey Thomas I | $300,000 | |
| Previous Owner | Hardey Thomas I | $100,000 |
Source: Public Records
Tax History
| Year | Tax Paid | Tax Assessment Tax Assessment Total Assessment is a certain percentage of the fair market value that is determined by local assessors to be the total taxable value of land and additions on the property. | Land | Improvement |
|---|---|---|---|---|
| 2025 | $14,008 | $1,310,400 | $621,100 | $689,300 |
| 2024 | $13,758 | $1,268,000 | $621,100 | $646,900 |
| 2023 | $12,111 | $1,211,100 | $621,100 | $590,000 |
| 2022 | $11,636 | $1,006,600 | $535,500 | $471,100 |
| 2021 | $11,405 | $966,500 | $535,500 | $431,000 |
| 2020 | $11,144 | $966,500 | $535,500 | $431,000 |
| 2019 | $10,666 | $903,100 | $535,500 | $367,600 |
| 2018 | $10,009 | $850,400 | $446,200 | $404,200 |
| 2017 | $9,644 | $787,300 | $436,700 | $350,600 |
| 2016 | $9,574 | $766,500 | $415,900 | $350,600 |
| 2015 | $9,356 | $746,700 | $396,100 | $350,600 |
Source: Public Records
Map
Nearby Homes
- 22 Downing St
- 21 Downing St
- 15 Downing St
- 11 Downing St
- 23 Downing St
- 10 Downing St
- 24 Downing St
- 7 Downing St
- 27 Downing St
- 7 Pleasant St
- 19 Pleasant St
- 30 Downing St
- 17 Pleasant St
- 29 Pleasant St
- 15 Pleasant St
- 9 Pleasant St Unit 4
- 9 Pleasant St Unit 3
- 9 Pleasant St Unit 2
- 9 Pleasant St Unit 1
- 9 Pleasant St
Your Personal Tour Guide
Ask me questions while you tour the home.