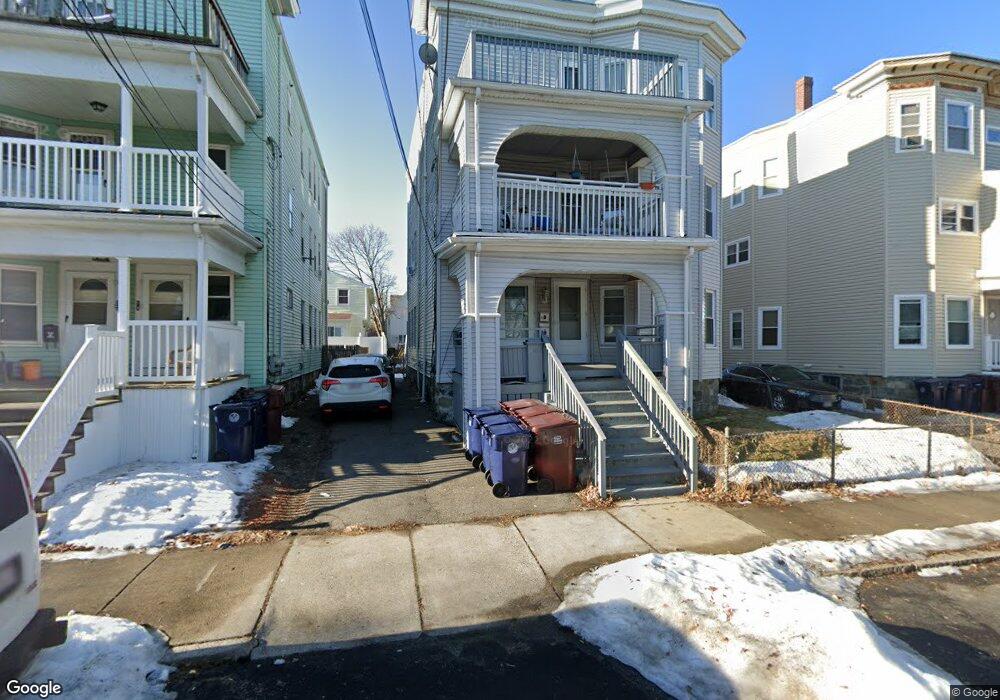
18 Dowse St Unit 3 Everett, MA 02149
Glendale NeighborhoodEstimated Value: $1,020,000 - $1,101,000
3
Beds
1
Bath
1,176
Sq Ft
$904/Sq Ft
Est. Value
About This Home
This home is located at 18 Dowse St Unit 3, Everett, MA 02149 and is currently estimated at $1,063,000, approximately $903 per square foot. 18 Dowse St Unit 3 is a home located in Middlesex County with nearby schools including Everett High School and Pioneer Charter School of Science.
Ownership History
Date
Name
Owned For
Owner Type
Purchase Details
Closed on
Jun 2, 2021
Sold by
Cornetta John Est and Cornetta
Bought by
Cornetta Lisa G
Current Estimated Value
Home Financials for this Owner
Home Financials are based on the most recent Mortgage that was taken out on this home.
Original Mortgage
$270,000
Outstanding Balance
$243,918
Interest Rate
2.9%
Mortgage Type
Stand Alone Refi Refinance Of Original Loan
Estimated Equity
$819,082
Purchase Details
Closed on
Oct 21, 2020
Sold by
Mary Cornetta Ft and Cornetta
Bought by
Cornetta John M
Home Financials for this Owner
Home Financials are based on the most recent Mortgage that was taken out on this home.
Original Mortgage
$25,000
Interest Rate
2.9%
Mortgage Type
Credit Line Revolving
Create a Home Valuation Report for This Property
The Home Valuation Report is an in-depth analysis detailing your home's value as well as a comparison with similar homes in the area
Home Values in the Area
Average Home Value in this Area
Purchase History
| Date | Buyer | Sale Price | Title Company |
|---|---|---|---|
| Cornetta Lisa G | -- | None Available | |
| Cornetta Lisa G | -- | None Available | |
| Cornetta John M | -- | None Available | |
| Cornetta John M | -- | None Available |
Source: Public Records
Mortgage History
| Date | Status | Borrower | Loan Amount |
|---|---|---|---|
| Open | Cornetta Lisa G | $270,000 | |
| Previous Owner | Cornetta John M | $25,000 |
Source: Public Records
Tax History
| Year | Tax Paid | Tax Assessment Tax Assessment Total Assessment is a certain percentage of the fair market value that is determined by local assessors to be the total taxable value of land and additions on the property. | Land | Improvement |
|---|---|---|---|---|
| 2025 | $10,998 | $965,600 | $254,500 | $711,100 |
| 2024 | $10,133 | $884,200 | $226,300 | $657,900 |
| 2023 | $9,887 | $839,300 | $207,400 | $631,900 |
| 2022 | $8,111 | $782,900 | $198,000 | $584,900 |
| 2021 | $7,341 | $743,800 | $177,200 | $566,600 |
| 2020 | $7,498 | $704,700 | $177,200 | $527,500 |
| 2019 | $7,720 | $623,600 | $168,800 | $454,800 |
| 2018 | $8,122 | $589,400 | $147,100 | $442,300 |
| 2017 | $7,647 | $529,600 | $113,100 | $416,500 |
| 2016 | $7,007 | $484,900 | $113,100 | $371,800 |
| 2015 | $6,667 | $456,300 | $106,300 | $350,000 |
Source: Public Records
Map
Nearby Homes
- 21 Central Ave Unit 10
- 21 Staples Ave Unit 26
- 15 Staples Ave Unit 45
- 15 Staples Ave Unit 31
- 44 Walnut St
- 132 Vernal St
- 210 Hancock St
- 13 Coolidge St
- 48 Cleveland Ave
- 19 Mills St
- 21 Hillside Ave Unit 21
- 139 Bucknam St
- 20 Fairmount St
- 53 Sycamore St
- 68 Linden St Unit 49
- 340 Main St
- 37 Argyle St
- 859 Broadway Unit 15
- 272-274 Cross St Unit 4
- 272-274 Cross St Unit 3
- 18 Dowse St
- 20 Dowse St
- 12 Dowse St
- 24 Dowse St
- 10 Dowse St
- 13 Woodland St Unit D
- 13 Woodland St Unit C
- 13 Woodland St Unit B
- 13 Woodland St Unit A
- 13 Woodland St
- 13 Woodland St Unit 28
- 15 Dowse St
- 21 Dowse St
- 21 Dowse St Unit 3
- 60 Vernal St Unit 2
- 11 Dowse St
- 8 Dowse St
- 8 Dowse St Unit 2
- 7 Dowse St
- 65 Central Ave
Your Personal Tour Guide
Ask me questions while you tour the home.