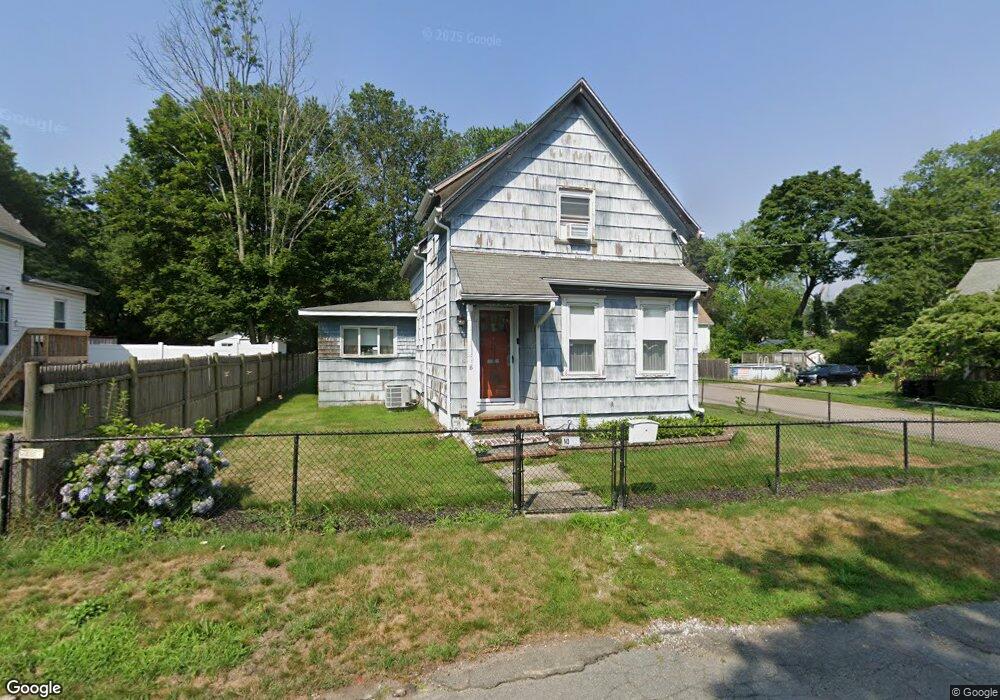
18 Dunham St Brockton, MA 02302
Estimated Value: $423,407 - $463,000
2
Beds
2
Baths
932
Sq Ft
$475/Sq Ft
Est. Value
About This Home
This home is located at 18 Dunham St, Brockton, MA 02302 and is currently estimated at $442,352, approximately $474 per square foot. 18 Dunham St is a home located in Plymouth County with nearby schools including Brookfield Elementary School, Downey Elementary School, and Mary E. Baker Elementary School.
Ownership History
Date
Name
Owned For
Owner Type
Purchase Details
Closed on
Aug 8, 2024
Sold by
Buck Karen I
Bought by
Buck Karen I and Buck Daniel R
Current Estimated Value
Purchase Details
Closed on
Oct 1, 2004
Sold by
Hayes Laura G and Ehler Lucas A
Bought by
Doherty Karen I
Home Financials for this Owner
Home Financials are based on the most recent Mortgage that was taken out on this home.
Original Mortgage
$177,600
Interest Rate
5.81%
Mortgage Type
Purchase Money Mortgage
Purchase Details
Closed on
Jul 30, 1999
Sold by
Cross Patricia R
Bought by
Hayes Laura G and Ehler Lucas A
Create a Home Valuation Report for This Property
The Home Valuation Report is an in-depth analysis detailing your home's value as well as a comparison with similar homes in the area
Purchase History
| Date | Buyer | Sale Price | Title Company |
|---|---|---|---|
| Buck Karen I | -- | None Available | |
| Buck Karen I | -- | None Available | |
| Doherty Karen I | $222,000 | -- | |
| Hayes Laura G | $120,000 | -- | |
| Doherty Karen I | $222,000 | -- | |
| Hayes Laura G | $120,000 | -- |
Source: Public Records
Mortgage History
| Date | Status | Borrower | Loan Amount |
|---|---|---|---|
| Previous Owner | Hayes Laura G | $206,250 | |
| Previous Owner | Hayes Laura G | $225,000 | |
| Previous Owner | Hayes Laura G | $177,600 |
Source: Public Records
Tax History
| Year | Tax Paid | Tax Assessment Tax Assessment Total Assessment is a certain percentage of the fair market value that is determined by local assessors to be the total taxable value of land and additions on the property. | Land | Improvement |
|---|---|---|---|---|
| 2025 | $4,567 | $377,100 | $140,100 | $237,000 |
| 2024 | $4,402 | $366,200 | $140,100 | $226,100 |
| 2023 | $4,015 | $309,300 | $104,500 | $204,800 |
| 2022 | $3,945 | $282,400 | $95,000 | $187,400 |
| 2021 | $3,551 | $244,900 | $78,900 | $166,000 |
| 2020 | $3,288 | $217,000 | $73,900 | $143,100 |
| 2019 | $2,999 | $193,000 | $72,100 | $120,900 |
| 2018 | $2,978 | $185,400 | $72,100 | $113,300 |
| 2017 | $2,756 | $171,200 | $72,100 | $99,100 |
| 2016 | $2,651 | $152,700 | $69,900 | $82,800 |
| 2015 | $2,285 | $125,900 | $69,900 | $56,000 |
| 2014 | $2,417 | $133,300 | $69,900 | $63,400 |
Source: Public Records
Map
Nearby Homes
Your Personal Tour Guide
Ask me questions while you tour the home.