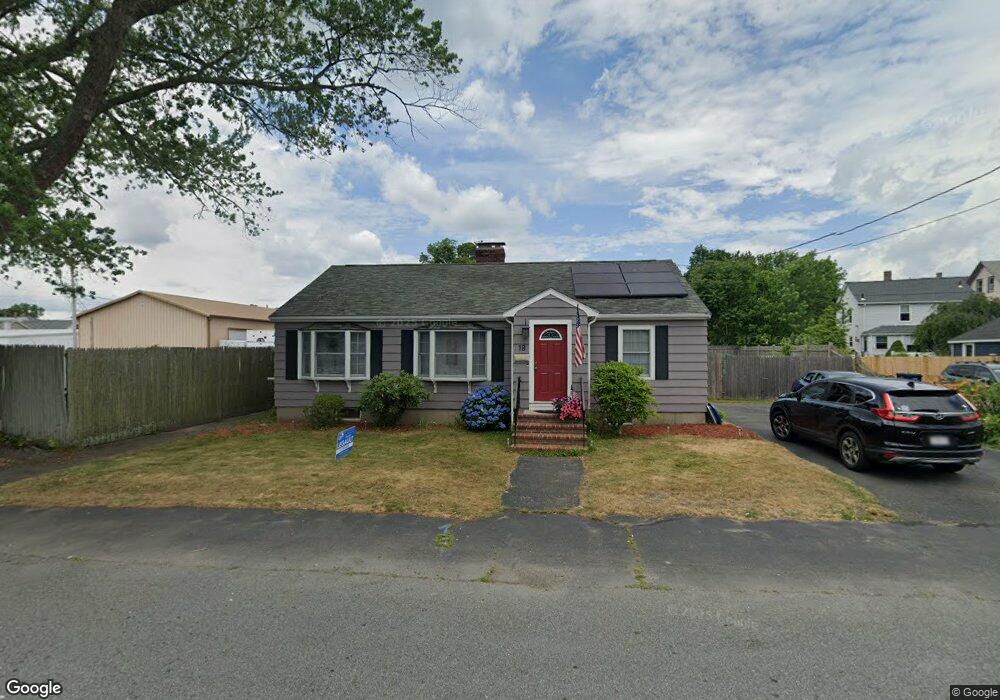
18 E Collins St Salem, MA 01970
Bridge Street NeighborhoodEstimated Value: $553,000 - $766,000
2
Beds
2
Baths
1,176
Sq Ft
$519/Sq Ft
Est. Value
About This Home
This home is located at 18 E Collins St, Salem, MA 01970 and is currently estimated at $610,842, approximately $519 per square foot. 18 E Collins St is a home located in Essex County with nearby schools including Carlton Elementary School, Saltonstall School, and Bates Elementary School.
Ownership History
Date
Name
Owned For
Owner Type
Purchase Details
Closed on
Jul 15, 2023
Sold by
Hiltunen Robert S and Hiltunen Valerie A
Bought by
Hiltunen Ft and Hiltunen
Current Estimated Value
Purchase Details
Closed on
Sep 28, 2001
Sold by
Desantis Rita M
Bought by
Hiltunen Robert S and Hiltunen Valerie A
Create a Home Valuation Report for This Property
The Home Valuation Report is an in-depth analysis detailing your home's value as well as a comparison with similar homes in the area
Home Values in the Area
Average Home Value in this Area
Purchase History
| Date | Buyer | Sale Price | Title Company |
|---|---|---|---|
| Hiltunen Ft | -- | None Available | |
| Hiltunen Robert S | $225,000 | -- |
Source: Public Records
Mortgage History
| Date | Status | Borrower | Loan Amount |
|---|---|---|---|
| Previous Owner | Hiltunen Robert S | $228,750 | |
| Previous Owner | Hiltunen Robert S | $15,000 | |
| Previous Owner | Hiltunen Robert S | $215,000 |
Source: Public Records
Tax History
| Year | Tax Paid | Tax Assessment Tax Assessment Total Assessment is a certain percentage of the fair market value that is determined by local assessors to be the total taxable value of land and additions on the property. | Land | Improvement |
|---|---|---|---|---|
| 2025 | $5,501 | $485,100 | $181,700 | $303,400 |
| 2024 | $5,492 | $472,600 | $172,100 | $300,500 |
| 2023 | $5,185 | $414,500 | $159,400 | $255,100 |
| 2022 | $4,824 | $364,100 | $149,800 | $214,300 |
| 2021 | $4,809 | $348,500 | $149,800 | $198,700 |
| 2020 | $4,513 | $312,300 | $129,400 | $182,900 |
| 2019 | $4,423 | $292,900 | $123,000 | $169,900 |
| 2018 | $4,193 | $272,600 | $117,300 | $155,300 |
| 2017 | $3,921 | $247,200 | $95,600 | $151,600 |
| 2016 | $3,794 | $242,100 | $90,500 | $151,600 |
| 2015 | $3,571 | $217,600 | $81,600 | $136,000 |
Source: Public Records
Map
Nearby Homes
- 21 Emerton St Unit 2
- 17 Webb St Unit 1
- 8 Webb St
- 31 N Washington Square Unit 3
- 16 Williams St
- 7 Forrester St
- 40 Essex St Unit 2
- 11 Williams St Unit 2
- 69 Essex St Unit 2
- 7 Curtis St Unit 1
- 131 Derby St Unit 3F
- 41 Dearborn St
- 17 Orchard St
- 10.5 Herbert St Unit 21
- 16 Franklin St Unit 2403
- 16 Franklin St Unit 1303
- 16 Franklin St Unit 2202
- 11 Church St Unit 203
- 11 Church St Unit 702
- 11 Church St Unit 703
- 15 1/2 E Collins St
- 36 Osgood St
- 15 E Collins St
- 32 Osgood St
- 3 Conners Rd
- 40 Osgood St
- 28 Osgood St
- 17 E Collins St
- 26 Osgood St
- 26 Osgood St Unit 2
- 5 Conners Rd
- 39 Osgood St
- 50 Osgood St
- 19 E Collins St
- 22 Osgood St
- 35 Osgood St
- 33 Osgood St Unit 1
- 33 Osgood St
- 33 Osgood St Unit 2
- 41 Osgood St Unit 43
Your Personal Tour Guide
Ask me questions while you tour the home.