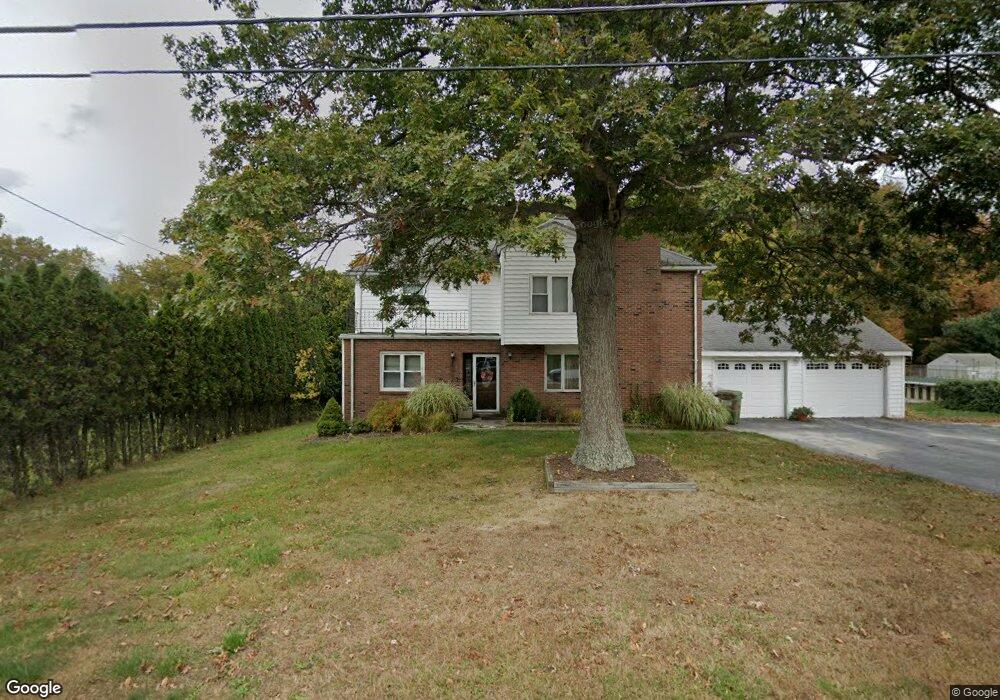
18 Eagle Dr Dudley, MA 01571
Estimated Value: $478,249 - $624,000
4
Beds
2
Baths
2,320
Sq Ft
$235/Sq Ft
Est. Value
About This Home
This home is located at 18 Eagle Dr, Dudley, MA 01571 and is currently estimated at $544,812, approximately $234 per square foot. 18 Eagle Dr is a home located in Worcester County with nearby schools including Shepherd Hill Regional High School, All Saints Academy, and St Joseph School.
Ownership History
Date
Name
Owned For
Owner Type
Purchase Details
Closed on
Jan 23, 2012
Sold by
Pierangeli Stephen F and Pierangeli Mary A
Bought by
Pierangeli Mary A
Current Estimated Value
Purchase Details
Closed on
May 17, 1984
Bought by
Pierangeli Mary A
Create a Home Valuation Report for This Property
The Home Valuation Report is an in-depth analysis detailing your home's value as well as a comparison with similar homes in the area
Home Values in the Area
Average Home Value in this Area
Purchase History
| Date | Buyer | Sale Price | Title Company |
|---|---|---|---|
| Pierangeli Mary A | -- | -- | |
| Pierangeli Mary A | $92,500 | -- |
Source: Public Records
Mortgage History
| Date | Status | Borrower | Loan Amount |
|---|---|---|---|
| Previous Owner | Pierangeli Mary A | $20,000 | |
| Previous Owner | Pierangeli Mary A | $75,000 | |
| Previous Owner | Pierangeli Mary A | $84,950 |
Source: Public Records
Tax History
| Year | Tax Paid | Tax Assessment Tax Assessment Total Assessment is a certain percentage of the fair market value that is determined by local assessors to be the total taxable value of land and additions on the property. | Land | Improvement |
|---|---|---|---|---|
| 2025 | $46 | $430,600 | $93,400 | $337,200 |
| 2024 | $4,500 | $429,400 | $94,200 | $335,200 |
| 2023 | $3,926 | $386,400 | $82,200 | $304,200 |
| 2022 | $3,876 | $331,300 | $77,200 | $254,100 |
| 2021 | $3,931 | $319,600 | $76,700 | $242,900 |
| 2020 | $3,914 | $299,700 | $72,300 | $227,400 |
| 2019 | $3,933 | $291,300 | $72,300 | $219,000 |
| 2018 | $3,286 | $280,100 | $72,300 | $207,800 |
| 2017 | $3,174 | $265,800 | $72,300 | $193,500 |
| 2016 | $3,219 | $264,300 | $71,800 | $192,500 |
| 2015 | $3,158 | $257,600 | $71,800 | $185,800 |
Source: Public Records
Map
Nearby Homes
Your Personal Tour Guide
Ask me questions while you tour the home.