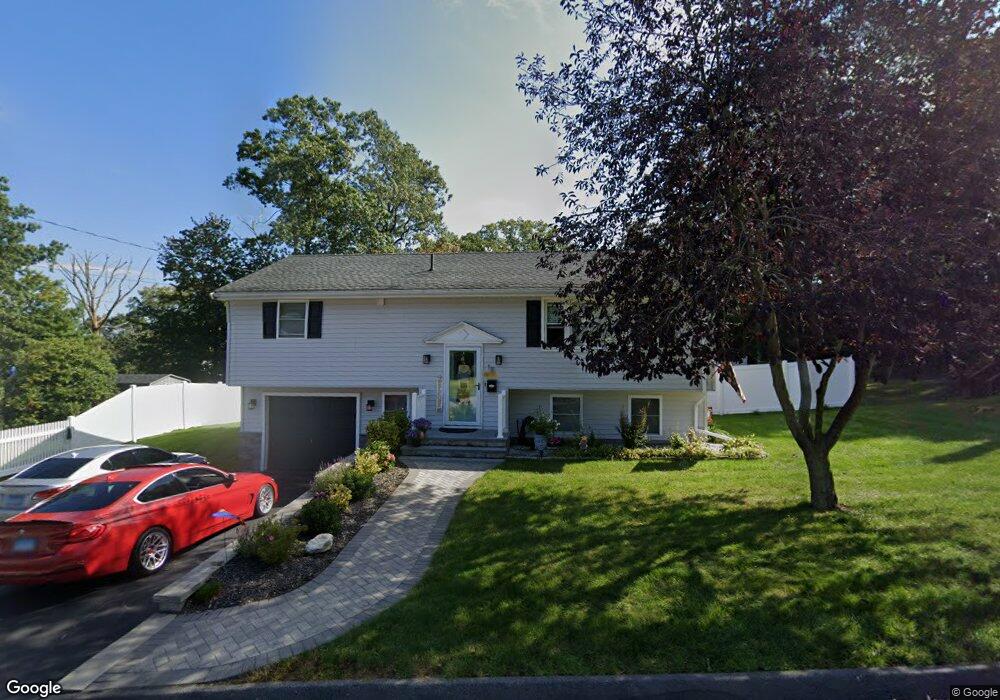
18 Echo Dr Willimantic, CT 06226
Estimated Value: $262,000 - $312,000
3
Beds
2
Baths
1,008
Sq Ft
$290/Sq Ft
Est. Value
About This Home
This home is located at 18 Echo Dr, Willimantic, CT 06226 and is currently estimated at $291,885, approximately $289 per square foot. 18 Echo Dr is a home located in Windham County with nearby schools including Windham Middle School, Windham High School, and Oak Grove Montessori School.
Ownership History
Date
Name
Owned For
Owner Type
Purchase Details
Closed on
Aug 3, 2010
Sold by
Robert Neida and Dejesus Juan J
Bought by
Colon Lurman and Colon Wilnelia
Current Estimated Value
Home Financials for this Owner
Home Financials are based on the most recent Mortgage that was taken out on this home.
Original Mortgage
$153,927
Outstanding Balance
$102,988
Interest Rate
4.78%
Mortgage Type
Purchase Money Mortgage
Estimated Equity
$188,897
Purchase Details
Closed on
Aug 28, 2003
Sold by
Santos Inia I and Santos Rosaly
Bought by
Dejesus Juan J and Rubert Neida
Home Financials for this Owner
Home Financials are based on the most recent Mortgage that was taken out on this home.
Original Mortgage
$111,150
Interest Rate
5.69%
Mortgage Type
Purchase Money Mortgage
Purchase Details
Closed on
May 31, 1995
Sold by
Anderson Gunars and Anderson Inara
Bought by
Santos Rosaly and Santos Tnia
Create a Home Valuation Report for This Property
The Home Valuation Report is an in-depth analysis detailing your home's value as well as a comparison with similar homes in the area
Home Values in the Area
Average Home Value in this Area
Purchase History
| Date | Buyer | Sale Price | Title Company |
|---|---|---|---|
| Colon Lurman | $156,000 | -- | |
| Dejesus Juan J | $117,000 | -- | |
| Santos Rosaly | $92,900 | -- |
Source: Public Records
Mortgage History
| Date | Status | Borrower | Loan Amount |
|---|---|---|---|
| Open | Santos Rosaly | $153,927 | |
| Closed | Santos Rosaly | $9,550 | |
| Previous Owner | Santos Rosaly | $25,000 | |
| Previous Owner | Santos Rosaly | $111,150 |
Source: Public Records
Tax History
| Year | Tax Paid | Tax Assessment Tax Assessment Total Assessment is a certain percentage of the fair market value that is determined by local assessors to be the total taxable value of land and additions on the property. | Land | Improvement |
|---|---|---|---|---|
| 2025 | $5,550 | $149,930 | $28,200 | $121,730 |
| 2024 | $5,556 | $149,930 | $28,200 | $121,730 |
| 2023 | $4,464 | $94,170 | $24,520 | $69,650 |
| 2022 | $4,398 | $94,170 | $24,520 | $69,650 |
| 2021 | $4,717 | $94,170 | $24,520 | $69,650 |
| 2020 | $4,707 | $94,170 | $24,520 | $69,650 |
| 2019 | $4,630 | $94,170 | $24,520 | $69,650 |
| 2017 | $4,012 | $84,270 | $21,750 | $62,520 |
| 2015 | $3,875 | $84,270 | $21,750 | $62,520 |
| 2014 | $3,660 | $84,270 | $21,750 | $62,520 |
Source: Public Records
Map
Nearby Homes
- 5 Kathleen Dr
- 10 Liberty Dr
- 18 Patriots Square Unit 18
- 73 Spring St
- 41 Spring St
- 5 Charles St
- 17 Pearl St
- 129 Valley St
- 60 Highland Rd
- 54 Meadowbrook Ln
- 335 Pleasant St
- 33 Oak Dr
- 48 Eastbrook Heights Unit C
- 40 Eastbrook Heights Unit C
- 0 Oak Dr Unit LOT 33
- 63 Eastbrook Heights Unit E
- 615 Jackson St
- 26 Maple Ave
- 0 Storrs Rd Unit 2 170571015
- 50 South St
Your Personal Tour Guide
Ask me questions while you tour the home.