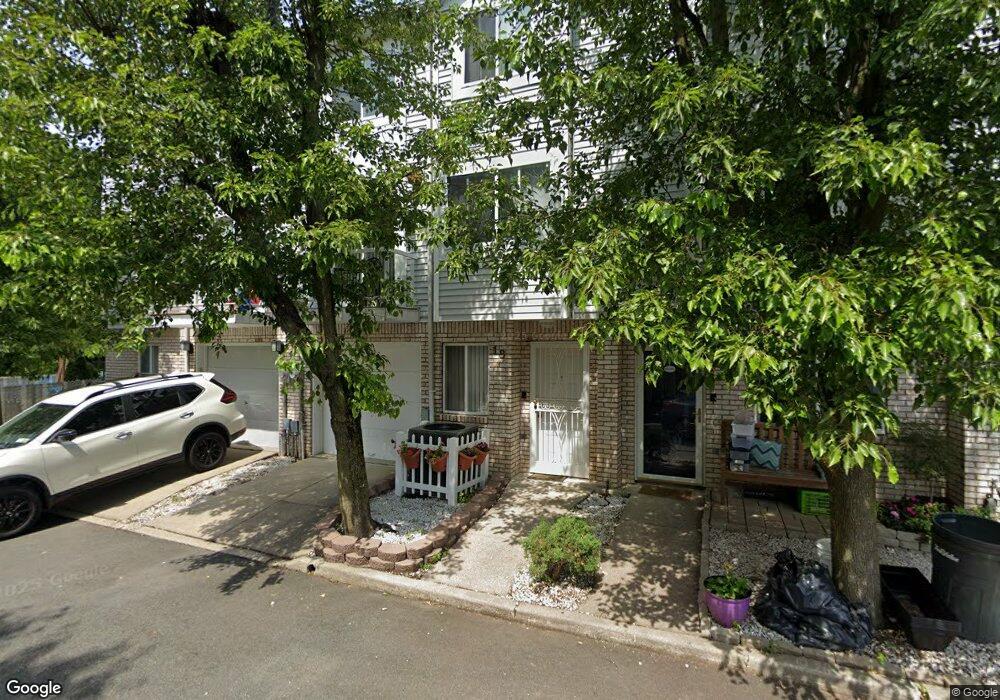
18 Elise Ct Unit PVT Staten Island, NY 10306
Great Kills NeighborhoodEstimated Value: $513,000 - $528,000
2
Beds
2
Baths
1,150
Sq Ft
$453/Sq Ft
Est. Value
About This Home
This home is located at 18 Elise Ct Unit PVT, Staten Island, NY 10306 and is currently estimated at $520,462, approximately $452 per square foot. 18 Elise Ct Unit PVT is a home located in Richmond County with nearby schools including P.S. 50 Frank Hankinson School, Myra S. Barnes Intermediate School 24, and Susan E Wagner High School.
Ownership History
Date
Name
Owned For
Owner Type
Purchase Details
Closed on
Jan 30, 2015
Sold by
Petersen Brenton and Petersen Connie
Bought by
Mazzella Nicole
Current Estimated Value
Home Financials for this Owner
Home Financials are based on the most recent Mortgage that was taken out on this home.
Original Mortgage
$239,000
Outstanding Balance
$183,595
Interest Rate
3.84%
Mortgage Type
New Conventional
Estimated Equity
$336,867
Purchase Details
Closed on
Oct 18, 1999
Sold by
Massamillo Jacqueline
Bought by
Petersen Brenton and Petersen Connie
Home Financials for this Owner
Home Financials are based on the most recent Mortgage that was taken out on this home.
Original Mortgage
$144,875
Interest Rate
7.83%
Create a Home Valuation Report for This Property
The Home Valuation Report is an in-depth analysis detailing your home's value as well as a comparison with similar homes in the area
Home Values in the Area
Average Home Value in this Area
Purchase History
| Date | Buyer | Sale Price | Title Company |
|---|---|---|---|
| Mazzella Nicole | $299,000 | Global United Abs Inc | |
| Petersen Brenton | $152,500 | Fidelity National Title Ins |
Source: Public Records
Mortgage History
| Date | Status | Borrower | Loan Amount |
|---|---|---|---|
| Open | Mazzella Nicole | $239,000 | |
| Previous Owner | Petersen Brenton | $144,875 |
Source: Public Records
Tax History Compared to Growth
Tax History
| Year | Tax Paid | Tax Assessment Tax Assessment Total Assessment is a certain percentage of the fair market value that is determined by local assessors to be the total taxable value of land and additions on the property. | Land | Improvement |
|---|---|---|---|---|
| 2025 | $3,988 | $27,960 | $7,349 | $20,611 |
| 2024 | $4,000 | $29,820 | $6,500 | $23,320 |
| 2023 | $3,988 | $21,254 | $6,237 | $15,017 |
| 2022 | $3,924 | $25,320 | $9,120 | $16,200 |
| 2021 | $3,885 | $23,820 | $9,120 | $14,700 |
| 2020 | $3,678 | $23,340 | $9,120 | $14,220 |
| 2019 | $3,412 | $22,500 | $9,120 | $13,380 |
| 2018 | $3,313 | $17,712 | $7,895 | $9,817 |
| 2017 | $3,283 | $17,577 | $8,536 | $9,041 |
| 2016 | $3,005 | $16,583 | $8,402 | $8,181 |
| 2015 | $2,528 | $15,645 | $8,963 | $6,682 |
| 2014 | $2,528 | $14,760 | $10,140 | $4,620 |
Source: Public Records
Map
Nearby Homes
- 15 Fuller Ct Unit A
- 25 Fuller Ct Unit A
- 8 Croft Ct
- 41 Croft Ct
- 50 Dina Ct
- 18 Atmore Place
- 98 Cotter Ave
- 38 Corona Ave
- 92 Boyce Ave
- 43 Cherrywood Ct
- 106 Redwood Ave
- 15 Corona Ave
- 33 Boyce Ave
- 67 Willowwood Ln
- 29 Ashwood Ct
- 11 Ironwood St
- 3461 Amboy Rd Unit 1J
- 52 Sandalwood Dr
- 181 Evergreen St
- 256 Thomas St