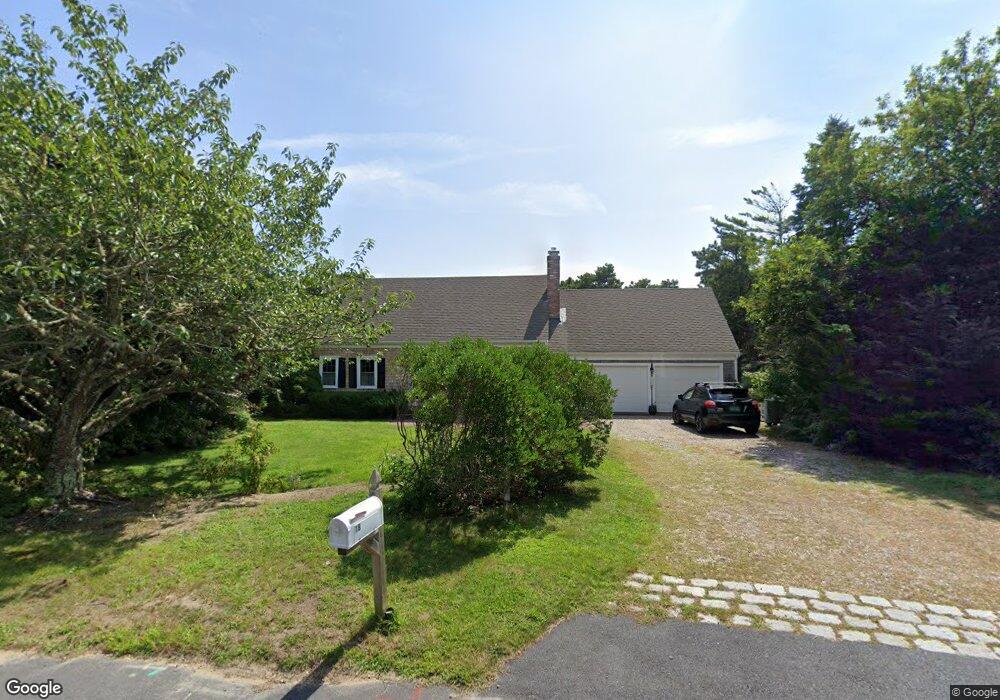
18 Ell St Chatham, MA 02633
West Chatham NeighborhoodEstimated Value: $1,688,185 - $2,185,000
3
Beds
4
Baths
2,448
Sq Ft
$829/Sq Ft
Est. Value
About This Home
This home is located at 18 Ell St, Chatham, MA 02633 and is currently estimated at $2,028,546, approximately $828 per square foot. 18 Ell St is a home located in Barnstable County with nearby schools including Chatham Elementary School, Harwich Elementary School, and Monomoy Regional Middle School.
Ownership History
Date
Name
Owned For
Owner Type
Purchase Details
Closed on
Aug 29, 2014
Sold by
Dow Ft
Bought by
Yindra Robert C and Yindra Tracie T
Current Estimated Value
Purchase Details
Closed on
Dec 10, 1993
Sold by
Paz Larry B and Paz Sharon L
Bought by
Dow Robert G and Dow Sabine
Home Financials for this Owner
Home Financials are based on the most recent Mortgage that was taken out on this home.
Original Mortgage
$200,000
Interest Rate
6.78%
Mortgage Type
Purchase Money Mortgage
Purchase Details
Closed on
Dec 4, 1991
Sold by
Whelden Elaine S
Bought by
Paz Larry B and Paz Sharon L
Create a Home Valuation Report for This Property
The Home Valuation Report is an in-depth analysis detailing your home's value as well as a comparison with similar homes in the area
Home Values in the Area
Average Home Value in this Area
Purchase History
| Date | Buyer | Sale Price | Title Company |
|---|---|---|---|
| Yindra Robert C | $890,000 | -- | |
| Dow Robert G | $124,000 | -- | |
| Paz Larry B | $95,000 | -- |
Source: Public Records
Mortgage History
| Date | Status | Borrower | Loan Amount |
|---|---|---|---|
| Previous Owner | Paz Larry B | $200,000 |
Source: Public Records
Tax History Compared to Growth
Tax History
| Year | Tax Paid | Tax Assessment Tax Assessment Total Assessment is a certain percentage of the fair market value that is determined by local assessors to be the total taxable value of land and additions on the property. | Land | Improvement |
|---|---|---|---|---|
| 2025 | $5,304 | $1,528,500 | $684,200 | $844,300 |
| 2024 | $4,897 | $1,371,700 | $645,500 | $726,200 |
| 2023 | $4,651 | $1,198,800 | $537,900 | $660,900 |
| 2022 | $4,602 | $996,100 | $537,900 | $458,200 |
| 2021 | $4,538 | $911,200 | $488,900 | $422,300 |
| 2020 | $4,210 | $873,500 | $488,900 | $384,600 |
| 2019 | $4,636 | $955,900 | $571,300 | $384,600 |
| 2018 | $4,504 | $924,900 | $571,100 | $353,800 |
| 2017 | $4,406 | $875,900 | $554,400 | $321,500 |
| 2016 | $4,331 | $862,700 | $543,600 | $319,100 |
| 2015 | $4,940 | $989,900 | $676,100 | $313,800 |
| 2014 | $4,542 | $894,000 | $581,100 | $312,900 |
Source: Public Records
Map
Nearby Homes
- 19 Captain Richards Way Unit 1
- 0 George Ryder Rd Unit 22301591
- 0 George Ryder Rd Unit 73104629
- 14 Pond View Ln
- 45 Meadow View Rd S
- 1761 Main St
- 6 Stephen Dr
- 40 Youngs Farm Ln
- 306 Old Queen Anne Rd
- 29 Wilfred Rd
- 14 Squanto Dr
- 38 Andover Dr
- 55 Christopher Harding Ln
- 99 Uncle Alberts Drive Extension
- 56 Skyline Dr
- 55 Winterset Dr
- 98 Horizon Dr
- 13 Captain Knowles Way
- 252 N Skyline Dr