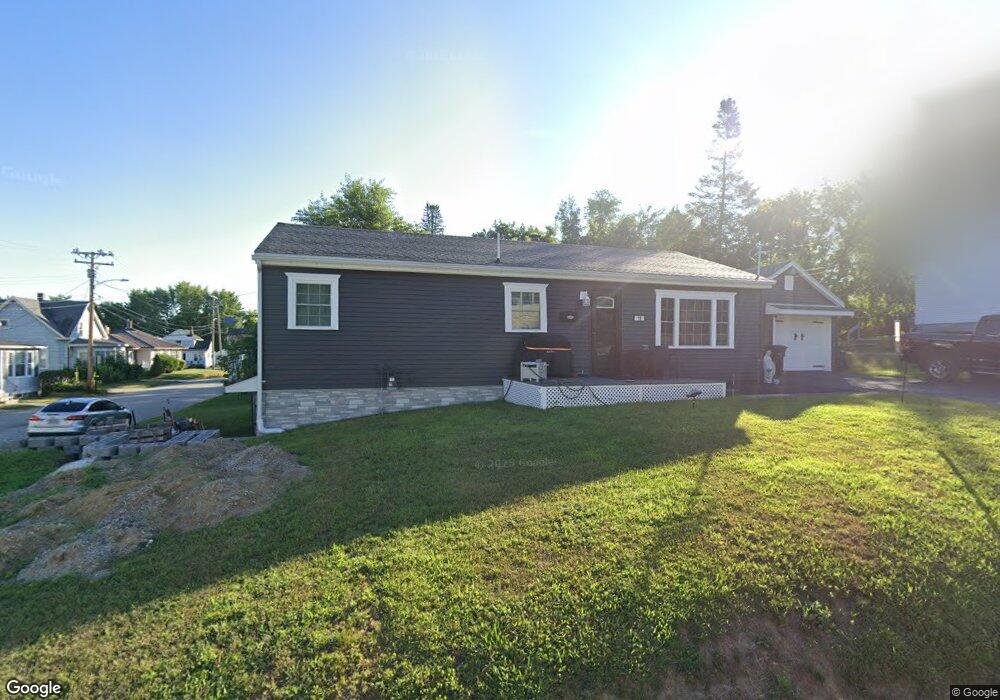
18 Elliott Ave Lewiston, ME 04240
Estimated Value: $260,000 - $320,000
3
Beds
1
Bath
1,008
Sq Ft
$286/Sq Ft
Est. Value
About This Home
This home is located at 18 Elliott Ave, Lewiston, ME 04240 and is currently estimated at $288,006, approximately $285 per square foot. 18 Elliott Ave is a home with nearby schools including Raymond A. Geiger Elementary School, Lewiston High School, and Central Maine Christian Academy.
Ownership History
Date
Name
Owned For
Owner Type
Purchase Details
Closed on
Jun 29, 2021
Sold by
Sullivan Joseph R
Bought by
Noyes Travis
Current Estimated Value
Home Financials for this Owner
Home Financials are based on the most recent Mortgage that was taken out on this home.
Original Mortgage
$171,830
Outstanding Balance
$155,231
Interest Rate
2.9%
Mortgage Type
FHA
Estimated Equity
$132,775
Purchase Details
Closed on
Jun 20, 2016
Sold by
Clark Gary D
Bought by
Sullivan 4Th Joseph R
Home Financials for this Owner
Home Financials are based on the most recent Mortgage that was taken out on this home.
Original Mortgage
$68,000
Interest Rate
3.61%
Mortgage Type
Unknown
Purchase Details
Closed on
Jun 8, 2012
Sold by
Clark Rita M
Bought by
Clark Rita M and Clark Gary D
Create a Home Valuation Report for This Property
The Home Valuation Report is an in-depth analysis detailing your home's value as well as a comparison with similar homes in the area
Home Values in the Area
Average Home Value in this Area
Purchase History
| Date | Buyer | Sale Price | Title Company |
|---|---|---|---|
| Noyes Travis | -- | None Available | |
| Sullivan 4Th Joseph R | -- | -- | |
| Clark Rita M | -- | -- |
Source: Public Records
Mortgage History
| Date | Status | Borrower | Loan Amount |
|---|---|---|---|
| Open | Noyes Travis | $171,830 | |
| Previous Owner | Sullivan 4Th Joseph R | $68,000 |
Source: Public Records
Tax History Compared to Growth
Tax History
| Year | Tax Paid | Tax Assessment Tax Assessment Total Assessment is a certain percentage of the fair market value that is determined by local assessors to be the total taxable value of land and additions on the property. | Land | Improvement |
|---|---|---|---|---|
| 2025 | $3,271 | $99,800 | $15,480 | $84,320 |
| 2024 | $3,104 | $97,700 | $15,480 | $82,220 |
| 2023 | $2,889 | $96,300 | $15,480 | $80,820 |
| 2022 | $2,745 | $96,300 | $15,480 | $80,820 |
| 2021 | $2,379 | $84,200 | $15,480 | $68,720 |
| 2020 | $2,414 | $84,200 | $15,480 | $68,720 |
| 2019 | $2,434 | $84,180 | $15,480 | $68,700 |
| 2018 | $2,413 | $84,180 | $15,480 | $68,700 |
| 2017 | $2,359 | $84,180 | $15,480 | $68,700 |
| 2016 | $2,318 | $84,180 | $15,480 | $68,700 |
| 2015 | $2,304 | $84,180 | $15,480 | $68,700 |
| 2014 | $2,238 | $84,180 | $15,480 | $68,700 |
| 2013 | $2,226 | $84,180 | $15,480 | $68,700 |
Source: Public Records
Map
Nearby Homes