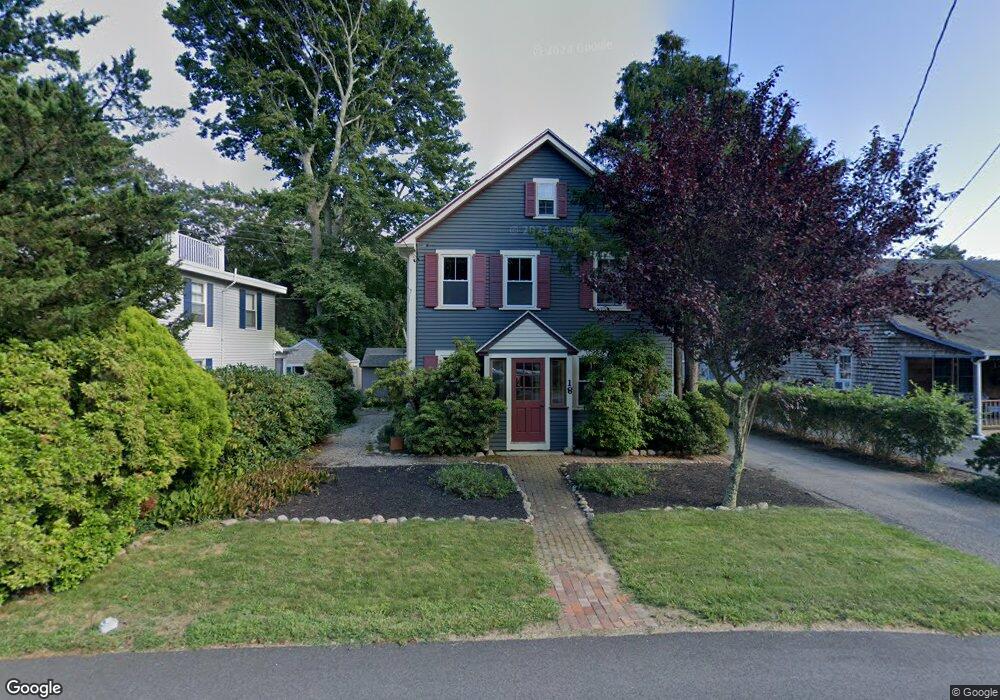
18 Elm Rd Falmouth, MA 02540
Falmouth Village NeighborhoodEstimated Value: $836,000 - $1,596,000
3
Beds
3
Baths
1,788
Sq Ft
$625/Sq Ft
Est. Value
About This Home
This home is located at 18 Elm Rd, Falmouth, MA 02540 and is currently estimated at $1,118,222, approximately $625 per square foot. 18 Elm Rd is a home located in Barnstable County with nearby schools including Mullen-Hall School, Lawrence School, and Morse Pond School.
Ownership History
Date
Name
Owned For
Owner Type
Purchase Details
Closed on
Jan 20, 2015
Sold by
Kranz Wendy M and Filippone Anthony G
Bought by
Harris Andrea and Filippone Anthony V
Current Estimated Value
Purchase Details
Closed on
Sep 17, 2009
Sold by
Filippone Anthony G and Krantz Wendy M
Bought by
Filippone Anthony G and Kranz Wendy M
Purchase Details
Closed on
Jun 2, 2000
Sold by
Kranz Wendy M
Bought by
Filippone Anthony G
Create a Home Valuation Report for This Property
The Home Valuation Report is an in-depth analysis detailing your home's value as well as a comparison with similar homes in the area
Home Values in the Area
Average Home Value in this Area
Purchase History
| Date | Buyer | Sale Price | Title Company |
|---|---|---|---|
| Harris Andrea | -- | -- | |
| Kranz Wendy M | -- | -- | |
| Filippone Anthony G | -- | -- | |
| Filippone Anthony G | -- | -- | |
| Filippone Anthony G | $300,000 | -- | |
| Filippone Anthony G | $300,000 | -- |
Source: Public Records
Tax History Compared to Growth
Tax History
| Year | Tax Paid | Tax Assessment Tax Assessment Total Assessment is a certain percentage of the fair market value that is determined by local assessors to be the total taxable value of land and additions on the property. | Land | Improvement |
|---|---|---|---|---|
| 2025 | $4,228 | $720,200 | $392,700 | $327,500 |
| 2024 | $4,074 | $648,800 | $357,000 | $291,800 |
| 2023 | $3,572 | $516,200 | $285,600 | $230,600 |
| 2022 | $3,655 | $454,000 | $236,500 | $217,500 |
| 2021 | $3,771 | $443,700 | $226,200 | $217,500 |
| 2020 | $3,634 | $423,100 | $205,600 | $217,500 |
| 2019 | $3,534 | $412,800 | $205,600 | $207,200 |
| 2018 | $3,490 | $405,800 | $205,600 | $200,200 |
| 2017 | $3,300 | $386,900 | $205,600 | $181,300 |
| 2016 | $3,238 | $386,900 | $205,600 | $181,300 |
| 2015 | $3,131 | $382,300 | $205,600 | $176,700 |
| 2014 | $3,000 | $368,100 | $205,700 | $162,400 |
Source: Public Records
Map
Nearby Homes
- 71 Main St
- 15 Hedge Ln
- 98 Main St
- 98 Main St Unit 1
- 65 Walker St
- 30 Katherine Lee Bates Rd
- 38 Landfall Unit 38
- 38 Landfall
- 33 Oakwood Ave
- 480 Main St Unit 1
- 87 Oyster Pond Rd
- 110 Dillingham Ave Unit 322
- 45 Haynes Ave
- 251 Woods Hole Rd
- 253 Scranton Ave
- 27 Upland Ave
- 354 Gifford St Unit 5
- 354 Gifford St Unit 2
- 354 Gifford St Unit 6