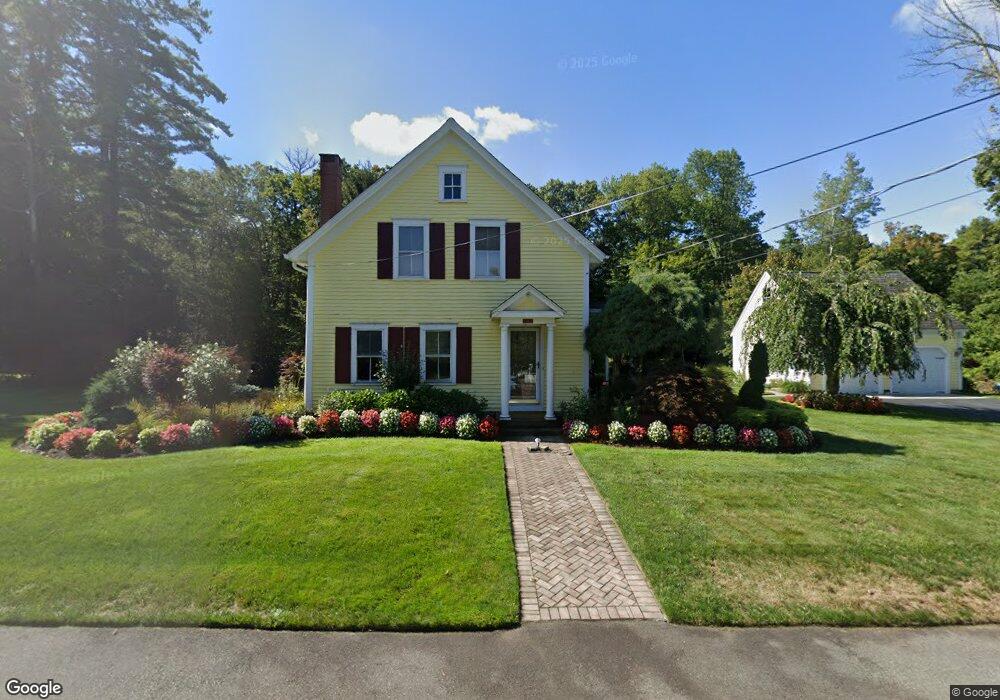
18 Elm St Assonet, MA 02702
Estimated Value: $536,000 - $610,000
3
Beds
3
Baths
1,829
Sq Ft
$308/Sq Ft
Est. Value
About This Home
This home is located at 18 Elm St, Assonet, MA 02702 and is currently estimated at $562,565, approximately $307 per square foot. 18 Elm St is a home located in Bristol County with nearby schools including Freetown Elementary School, George R Austin Intermediate School, and Freetown-Lakeville Middle School.
Ownership History
Date
Name
Owned For
Owner Type
Purchase Details
Closed on
Jun 15, 1994
Sold by
Wood James F and Wood Helen L
Bought by
Sousa Richard
Current Estimated Value
Home Financials for this Owner
Home Financials are based on the most recent Mortgage that was taken out on this home.
Original Mortgage
$137,750
Interest Rate
8.5%
Mortgage Type
Purchase Money Mortgage
Create a Home Valuation Report for This Property
The Home Valuation Report is an in-depth analysis detailing your home's value as well as a comparison with similar homes in the area
Home Values in the Area
Average Home Value in this Area
Purchase History
| Date | Buyer | Sale Price | Title Company |
|---|---|---|---|
| Sousa Richard | $145,000 | -- |
Source: Public Records
Mortgage History
| Date | Status | Borrower | Loan Amount |
|---|---|---|---|
| Open | Sousa Richard | $180,000 | |
| Closed | Sousa Richard | $118,300 | |
| Closed | Sousa Richard | $137,750 | |
| Previous Owner | Sousa Richard | $50,000 |
Source: Public Records
Tax History Compared to Growth
Tax History
| Year | Tax Paid | Tax Assessment Tax Assessment Total Assessment is a certain percentage of the fair market value that is determined by local assessors to be the total taxable value of land and additions on the property. | Land | Improvement |
|---|---|---|---|---|
| 2025 | $4,524 | $456,500 | $167,700 | $288,800 |
| 2024 | $4,496 | $431,100 | $158,200 | $272,900 |
| 2023 | $4,359 | $407,000 | $142,500 | $264,500 |
| 2022 | $4,174 | $346,100 | $120,700 | $225,400 |
| 2021 | $4,026 | $317,000 | $109,700 | $207,300 |
| 2020 | $3,914 | $300,600 | $100,000 | $200,600 |
| 2019 | $3,625 | $275,700 | $95,200 | $180,500 |
| 2018 | $3,369 | $253,100 | $95,200 | $157,900 |
| 2017 | $3,286 | $246,700 | $95,200 | $151,500 |
| 2016 | $2,982 | $227,800 | $102,800 | $125,000 |
| 2015 | $2,937 | $227,700 | $102,800 | $124,900 |
| 2014 | $2,841 | $225,300 | $100,600 | $124,700 |
Source: Public Records
Map
Nearby Homes
- 1 Elm St
- 37 Simpson Ln
- 5 Hadley Heights Way
- 16 Water St Unit A
- 16 Water St Unit C
- 16 Water St Unit B
- 16 Water St Unit D
- 4 Hadley Heights Way
- 20 Slab Bridge Rd
- 6 Weetamoe Dr
- 22 Freemens Cir
- 42 High St
- 17 E Public St
- 111 High St
- 0 Bayview Ave
- 125 Bayview Ave
- 195 Slab Bridge Rd
- 52 Anthony St
- 35 Water St
- 7 Great Cedar Crossing