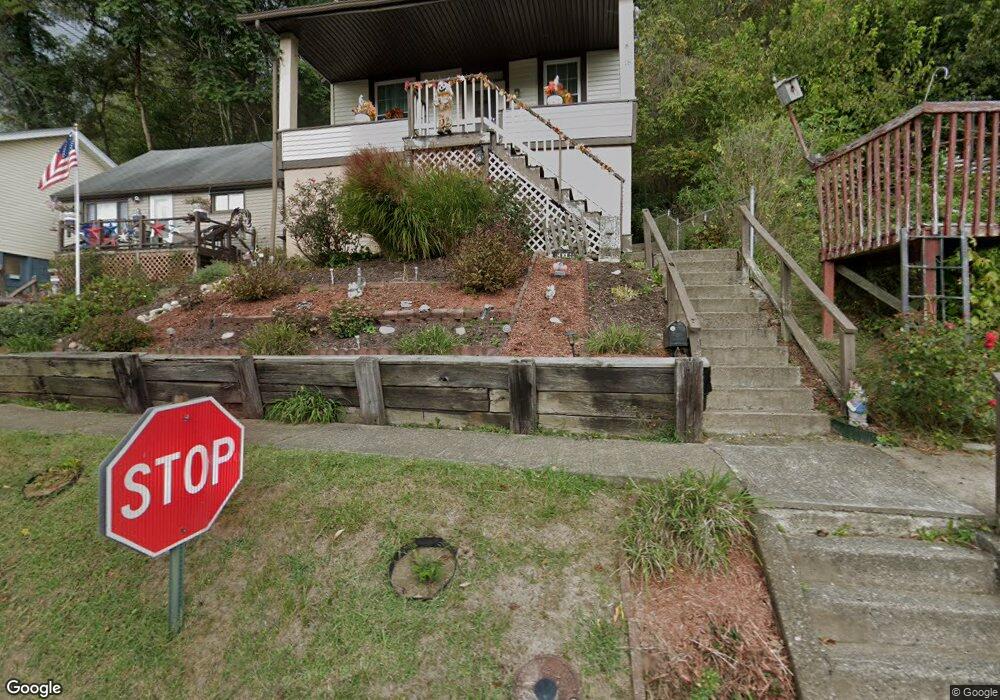
18 Elm St Bridgeport, OH 43912
Estimated Value: $73,000 - $117,000
2
Beds
1
Bath
1,016
Sq Ft
$88/Sq Ft
Est. Value
About This Home
This home is located at 18 Elm St, Bridgeport, OH 43912 and is currently estimated at $89,028, approximately $87 per square foot. 18 Elm St is a home located in Belmont County with nearby schools including Bridgeport Elementary School, Bridgeport Middle School, and Bridgeport High School.
Ownership History
Date
Name
Owned For
Owner Type
Purchase Details
Closed on
Feb 5, 2009
Sold by
Stewart Bruce A and Stewart Brenda
Bought by
Stewart William E
Current Estimated Value
Home Financials for this Owner
Home Financials are based on the most recent Mortgage that was taken out on this home.
Original Mortgage
$16,000
Interest Rate
5.08%
Mortgage Type
Future Advance Clause Open End Mortgage
Purchase Details
Closed on
Sep 3, 1996
Sold by
Stewart Bruce A
Bought by
Stewart Bruce A
Purchase Details
Closed on
Aug 8, 1994
Sold by
Cash Joel D and Cash Cindy L
Bought by
Cash Joel D and Cash Cindy L
Purchase Details
Closed on
Jan 1, 1986
Sold by
Weisal Arthur E
Bought by
Weisal Arthur E
Create a Home Valuation Report for This Property
The Home Valuation Report is an in-depth analysis detailing your home's value as well as a comparison with similar homes in the area
Home Values in the Area
Average Home Value in this Area
Purchase History
| Date | Buyer | Sale Price | Title Company |
|---|---|---|---|
| Stewart William E | $25,000 | Attorney | |
| Stewart Bruce A | $25,000 | -- | |
| Cash Joel D | $20,000 | -- | |
| Weisal Arthur E | -- | -- |
Source: Public Records
Mortgage History
| Date | Status | Borrower | Loan Amount |
|---|---|---|---|
| Closed | Stewart William E | $16,000 |
Source: Public Records
Tax History Compared to Growth
Tax History
| Year | Tax Paid | Tax Assessment Tax Assessment Total Assessment is a certain percentage of the fair market value that is determined by local assessors to be the total taxable value of land and additions on the property. | Land | Improvement |
|---|---|---|---|---|
| 2024 | $900 | $23,740 | $2,170 | $21,570 |
| 2023 | $913 | $21,760 | $2,170 | $19,590 |
| 2022 | $912 | $21,760 | $2,174 | $19,586 |
| 2021 | $926 | $21,760 | $2,174 | $19,586 |
| 2020 | $803 | $18,920 | $1,890 | $17,030 |
| 2019 | $805 | $18,920 | $1,890 | $17,030 |
| 2018 | $796 | $18,920 | $1,890 | $17,030 |
| 2017 | $769 | $16,390 | $1,680 | $14,710 |
| 2016 | $757 | $16,390 | $1,680 | $14,710 |
| 2015 | $754 | $16,390 | $1,680 | $14,710 |
| 2014 | $789 | $16,690 | $1,520 | $15,170 |
| 2013 | $749 | $16,690 | $1,520 | $15,170 |
Source: Public Records
Map
Nearby Homes
- 26 Elm St
- 902 National Rd
- 4 Walnut Ave
- 56316 National Rd
- 866 Main St
- 836 Main St
- 56065 National Rd
- 56624 Boyd Ave
- 1123 Minellen Dr
- 824 Howard St
- 822 W Bennett St
- 69142 Woods Rd
- 629 1/2 Howard St
- 67478 Kirkwood Heights Rd
- 67531 Kirkwood Heights Rd
- 55500 National Rd
- 55490 National Rd
- 55480 National Rd
- 244 Lombardy Heights
- 308 Whitely St