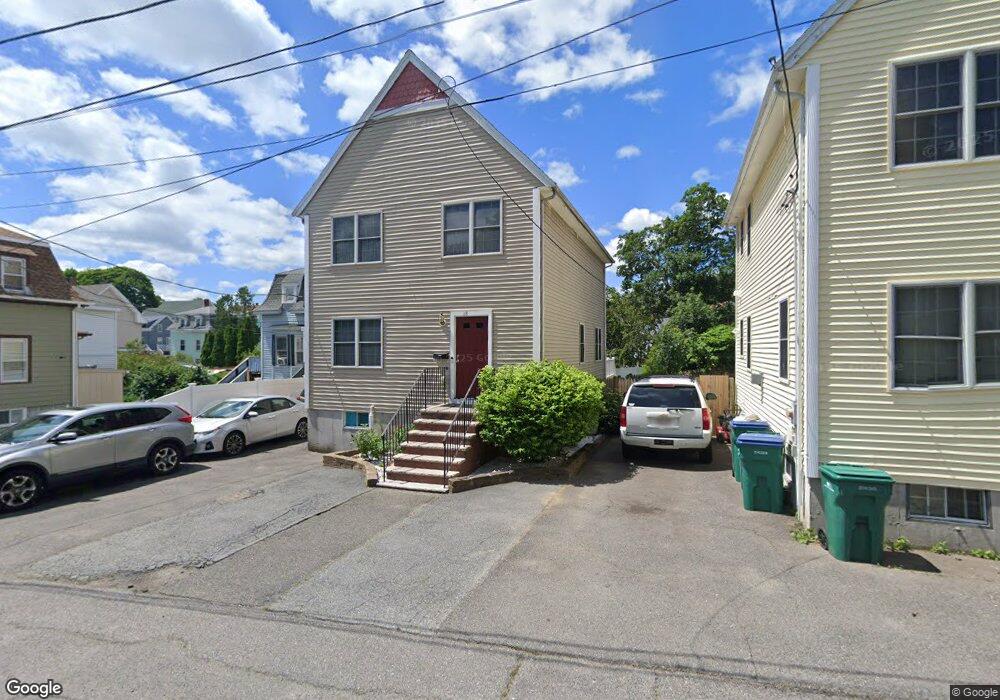
18 Elmore St Lynn, MA 01902
Fayette Street NeighborhoodEstimated Value: $618,000 - $650,000
3
Beds
2
Baths
1,584
Sq Ft
$400/Sq Ft
Est. Value
About This Home
This home is located at 18 Elmore St, Lynn, MA 01902 and is currently estimated at $634,104, approximately $400 per square foot. 18 Elmore St is a home located in Essex County with nearby schools including Ingalls Elementary School, William R. Fallon School, and Marshall Middle School.
Ownership History
Date
Name
Owned For
Owner Type
Purchase Details
Closed on
Nov 4, 2005
Sold by
Ainsworth Rt and Potter David
Bought by
Fernandes Savorn Ouk
Current Estimated Value
Home Financials for this Owner
Home Financials are based on the most recent Mortgage that was taken out on this home.
Original Mortgage
$307,800
Outstanding Balance
$165,682
Interest Rate
5.85%
Mortgage Type
Purchase Money Mortgage
Estimated Equity
$468,422
Purchase Details
Closed on
Jun 24, 2004
Sold by
Lynn City
Bought by
Potter David J
Home Financials for this Owner
Home Financials are based on the most recent Mortgage that was taken out on this home.
Original Mortgage
$75,000
Interest Rate
6.32%
Mortgage Type
Purchase Money Mortgage
Create a Home Valuation Report for This Property
The Home Valuation Report is an in-depth analysis detailing your home's value as well as a comparison with similar homes in the area
Home Values in the Area
Average Home Value in this Area
Purchase History
| Date | Buyer | Sale Price | Title Company |
|---|---|---|---|
| Fernandes Savorn Ouk | $324,000 | -- | |
| Fernandes Savorn Ouk | $324,000 | -- | |
| Potter David J | $80,100 | -- | |
| Potter David J | $80,100 | -- |
Source: Public Records
Mortgage History
| Date | Status | Borrower | Loan Amount |
|---|---|---|---|
| Open | Potter David J | $307,800 | |
| Closed | Potter David J | $307,800 | |
| Previous Owner | Potter David J | $212,000 | |
| Previous Owner | Potter David J | $75,000 |
Source: Public Records
Tax History
| Year | Tax Paid | Tax Assessment Tax Assessment Total Assessment is a certain percentage of the fair market value that is determined by local assessors to be the total taxable value of land and additions on the property. | Land | Improvement |
|---|---|---|---|---|
| 2025 | $6,635 | $640,400 | $184,000 | $456,400 |
| 2024 | $6,361 | $604,100 | $174,900 | $429,200 |
| 2023 | $6,011 | $539,100 | $159,300 | $379,800 |
| 2022 | $6,164 | $495,900 | $143,100 | $352,800 |
| 2021 | $5,741 | $440,600 | $128,900 | $311,700 |
| 2020 | $5,286 | $394,500 | $119,800 | $274,700 |
| 2019 | $5,147 | $359,900 | $103,300 | $256,600 |
| 2018 | $4,866 | $321,200 | $95,500 | $225,700 |
| 2017 | $4,694 | $300,900 | $89,400 | $211,500 |
| 2016 | $4,474 | $276,500 | $76,800 | $199,700 |
| 2015 | $4,214 | $251,600 | $69,300 | $182,300 |
Source: Public Records
Map
Nearby Homes
Your Personal Tour Guide
Ask me questions while you tour the home.