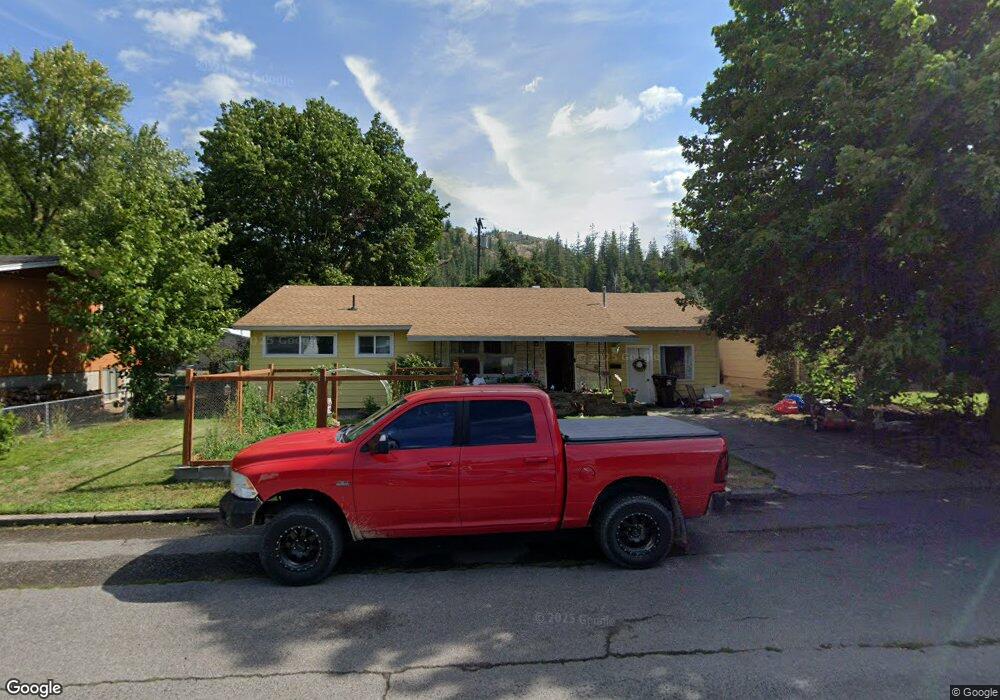
18 Engdahl Ave Kellogg, ID 83837
Estimated Value: $288,842 - $320,000
3
Beds
1
Bath
1,403
Sq Ft
$213/Sq Ft
Est. Value
About This Home
This home is located at 18 Engdahl Ave, Kellogg, ID 83837 and is currently estimated at $298,961, approximately $213 per square foot. 18 Engdahl Ave is a home located in Shoshone County with nearby schools including Pinehurst Elementary School, Kellogg Middle School, and Kellogg High School.
Ownership History
Date
Name
Owned For
Owner Type
Purchase Details
Closed on
Jun 30, 2020
Sold by
Fannie Mae
Bought by
Dye Zachery A
Current Estimated Value
Home Financials for this Owner
Home Financials are based on the most recent Mortgage that was taken out on this home.
Original Mortgage
$156,170
Outstanding Balance
$138,738
Interest Rate
3.2%
Mortgage Type
New Conventional
Estimated Equity
$160,223
Purchase Details
Closed on
Jan 22, 2020
Sold by
Weaser Ida and Weaser Eugene
Bought by
Federal National Mortgage Association
Purchase Details
Closed on
Jun 21, 2019
Sold by
Estate Of Eugene D Weaser
Bought by
Federal National Mortgage Association and Quicken Loans Inc
Purchase Details
Closed on
Sep 15, 2016
Sold by
Weaser Eugene and Weaser Ida Susana
Bought by
Weaser Ida Susana
Create a Home Valuation Report for This Property
The Home Valuation Report is an in-depth analysis detailing your home's value as well as a comparison with similar homes in the area
Home Values in the Area
Average Home Value in this Area
Purchase History
| Date | Buyer | Sale Price | Title Company |
|---|---|---|---|
| Dye Zachery A | -- | Alliance Title Boise Product | |
| Federal National Mortgage Association | $102,900 | None Available | |
| Federal National Mortgage Association | $102,900 | None Available | |
| Weaser Ida Susana | -- | Title Source |
Source: Public Records
Mortgage History
| Date | Status | Borrower | Loan Amount |
|---|---|---|---|
| Open | Dye Zachery A | $156,170 |
Source: Public Records
Tax History Compared to Growth
Tax History
| Year | Tax Paid | Tax Assessment Tax Assessment Total Assessment is a certain percentage of the fair market value that is determined by local assessors to be the total taxable value of land and additions on the property. | Land | Improvement |
|---|---|---|---|---|
| 2025 | $985 | $277,792 | $57,101 | $220,691 |
| 2024 | $985 | $277,792 | $57,101 | $220,691 |
| 2023 | $985 | $243,474 | $57,101 | $186,373 |
| 2022 | $929 | $206,004 | $47,450 | $158,554 |
| 2021 | $944 | $136,387 | $33,067 | $103,320 |
| 2020 | $1,492 | $118,539 | $31,009 | $87,530 |
| 2019 | $1,388 | $101,718 | $27,628 | $74,090 |
| 2018 | $1,550 | $75,608 | $22,628 | $52,980 |
| 2017 | $1,197 | $80,188 | $22,628 | $57,560 |
| 2016 | -- | $79,868 | $22,628 | $57,240 |
| 2015 | -- | $79,868 | $22,628 | $57,240 |
| 2014 | -- | $68,658 | $22,628 | $46,030 |
Source: Public Records
Map
Nearby Homes
- 46 Park Cir
- 51707 #10A Silver Valley Rd
- 53917 Silver Valley Rd
- NKA Presley Ave
- 1247 Montgomery Gulch Rd
- NKA Alhambra
- NKA Country Club Rd
- NNA County Club Rd
- 51833 Silver Valley Rd
- 86 E Circle Dr
- 150 Morning Star Dr Unit 371
- 110 Morning Star Dr Unit 332
- 110 Morning Star Dr Unit 159
- 0 Vergobbi Unit 25-4752
- 5 W Mill Ave
- 3 Polaris Peak Rd
- 2 Polaris Peak Rd
- 1 Polaris Peak Rd
- 130 W Mullan Ave
- 408A 410A S Main St