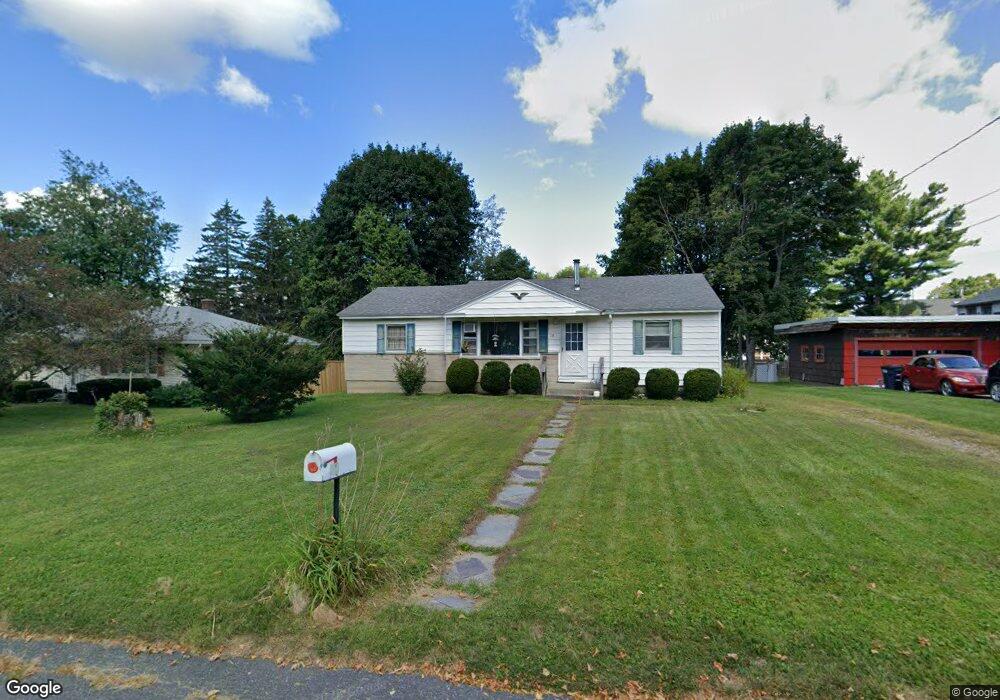
18 Evelyn St Dalton, MA 01226
Estimated Value: $280,405 - $337,000
3
Beds
3
Baths
1,268
Sq Ft
$234/Sq Ft
Est. Value
About This Home
This home is located at 18 Evelyn St, Dalton, MA 01226 and is currently estimated at $296,601, approximately $233 per square foot. 18 Evelyn St is a home located in Berkshire County with nearby schools including Wahconah Regional High School, St. Agnes Academy, and Branches School of the Berkshires.
Ownership History
Date
Name
Owned For
Owner Type
Purchase Details
Closed on
Dec 20, 2017
Sold by
Neff Maureen A Est and Neff
Bought by
Neff Michael J
Current Estimated Value
Purchase Details
Closed on
Nov 6, 1992
Sold by
Wormwood Kenneth R and Wormwood Elaine S
Bought by
Hoisington Maureen and Rupinski Doris E
Home Financials for this Owner
Home Financials are based on the most recent Mortgage that was taken out on this home.
Original Mortgage
$94,050
Interest Rate
7.99%
Mortgage Type
Purchase Money Mortgage
Create a Home Valuation Report for This Property
The Home Valuation Report is an in-depth analysis detailing your home's value as well as a comparison with similar homes in the area
Home Values in the Area
Average Home Value in this Area
Purchase History
| Date | Buyer | Sale Price | Title Company |
|---|---|---|---|
| Neff Michael J | -- | -- | |
| Neff Michael J | -- | -- | |
| Hoisington Maureen | $90,000 | -- | |
| Hoisington Maureen | $90,000 | -- |
Source: Public Records
Mortgage History
| Date | Status | Borrower | Loan Amount |
|---|---|---|---|
| Previous Owner | Hoisington Maureen | $94,050 | |
| Previous Owner | Hoisington Maureen | $40,020 |
Source: Public Records
Tax History
| Year | Tax Paid | Tax Assessment Tax Assessment Total Assessment is a certain percentage of the fair market value that is determined by local assessors to be the total taxable value of land and additions on the property. | Land | Improvement |
|---|---|---|---|---|
| 2025 | $4,108 | $226,600 | $60,100 | $166,500 |
| 2024 | $3,840 | $211,000 | $54,400 | $156,600 |
| 2023 | $3,287 | $181,100 | $48,100 | $133,000 |
| 2022 | $3,287 | $158,500 | $48,100 | $110,400 |
| 2021 | $3,248 | $151,000 | $45,800 | $105,200 |
| 2020 | $2,950 | $145,400 | $45,800 | $99,600 |
| 2019 | $3,187 | $163,600 | $43,500 | $120,100 |
| 2018 | $3,164 | $158,900 | $43,500 | $115,400 |
| 2017 | $3,157 | $158,900 | $43,500 | $115,400 |
| 2016 | $3,119 | $158,900 | $43,500 | $115,400 |
| 2015 | $3,047 | $156,500 | $43,500 | $113,000 |
Source: Public Records
Map
Nearby Homes
Your Personal Tour Guide
Ask me questions while you tour the home.