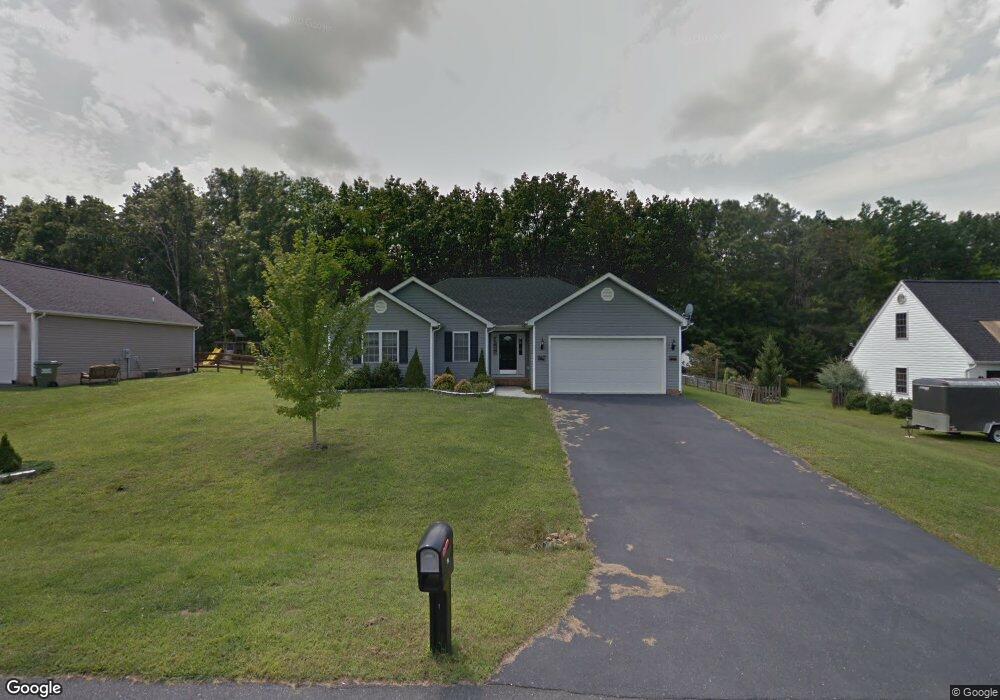
18 Fall Ridge Dr Stuarts Draft, VA 24477
Estimated Value: $332,610 - $363,000
3
Beds
2
Baths
1,336
Sq Ft
$258/Sq Ft
Est. Value
About This Home
This home is located at 18 Fall Ridge Dr, Stuarts Draft, VA 24477 and is currently estimated at $344,403, approximately $257 per square foot. 18 Fall Ridge Dr is a home located in Augusta County with nearby schools including Stuarts Draft Elementary School, Stuarts Draft Middle School, and Stuarts Draft High School.
Ownership History
Date
Name
Owned For
Owner Type
Purchase Details
Closed on
Jul 13, 2012
Sold by
The Secretary Of Housing And Urban Devel
Bought by
Templeton Mark
Current Estimated Value
Home Financials for this Owner
Home Financials are based on the most recent Mortgage that was taken out on this home.
Original Mortgage
$145,350
Outstanding Balance
$100,665
Interest Rate
3.74%
Mortgage Type
New Conventional
Estimated Equity
$243,738
Purchase Details
Closed on
Apr 3, 2012
Sold by
Wells Fargo Bank Na
Bought by
The Secretary Of Housing & Urban Develop
Purchase Details
Closed on
Mar 29, 2012
Sold by
Heenan Sean M
Bought by
Wells Fargo Bank Na
Purchase Details
Closed on
Aug 9, 2005
Sold by
Sparks Shaun D and Sparks Cynthia R
Bought by
Heenan Sean M
Home Financials for this Owner
Home Financials are based on the most recent Mortgage that was taken out on this home.
Original Mortgage
$173,565
Interest Rate
5.54%
Mortgage Type
FHA
Create a Home Valuation Report for This Property
The Home Valuation Report is an in-depth analysis detailing your home's value as well as a comparison with similar homes in the area
Purchase History
| Date | Buyer | Sale Price | Title Company |
|---|---|---|---|
| Templeton Mark | $153,000 | Atg Title Inc | |
| The Secretary Of Housing & Urban Develop | $188,215 | None Available | |
| Wells Fargo Bank Na | $179,908 | None Available | |
| Heenan Sean M | -- | -- |
Source: Public Records
Mortgage History
| Date | Status | Borrower | Loan Amount |
|---|---|---|---|
| Open | Templeton Mark | $145,350 | |
| Previous Owner | Heenan Sean M | $173,565 |
Source: Public Records
Tax History
| Year | Tax Paid | Tax Assessment Tax Assessment Total Assessment is a certain percentage of the fair market value that is determined by local assessors to be the total taxable value of land and additions on the property. | Land | Improvement |
|---|---|---|---|---|
| 2025 | $1,460 | $280,700 | $60,000 | $220,700 |
| 2024 | $1,480 | $284,600 | $60,000 | $224,600 |
| 2023 | $1,215 | $192,800 | $55,000 | $137,800 |
| 2022 | $1,215 | $192,800 | $55,000 | $137,800 |
| 2021 | $1,215 | $192,800 | $55,000 | $137,800 |
| 2020 | $1,215 | $192,800 | $55,000 | $137,800 |
| 2019 | $1,215 | $192,800 | $55,000 | $137,800 |
| 2018 | $1,114 | $176,835 | $55,000 | $121,835 |
| 2017 | $1,025 | $176,835 | $55,000 | $121,835 |
| 2016 | $1,025 | $176,835 | $55,000 | $121,835 |
| 2015 | $859 | $176,835 | $55,000 | $121,835 |
| 2014 | $859 | $176,835 | $55,000 | $121,835 |
| 2013 | $859 | $178,900 | $60,000 | $118,900 |
Source: Public Records
Map
Nearby Homes
- 122 Spring Ridge Dr
- 117 Spring Ridge Dr
- 149 China Clay Rd
- 514 Lipscomb Rd
- 00 Lyndhurst Rd
- 114 Jaspers Ln
- 00 Lipscomb Rd
- 19 Mathews Ln
- 1325 Mt Torrey Rd
- 1059 Mt Torrey Rd
- 38 Greenbriar Ln
- 501 Howardsville Turnpike
- 0 Mount Torrey Rd
- 001 Mount Torrey Rd
- 1655 Howardsville Turnpike
- 1932 Howardsville Turnpike
- 162 Locust Grove Ln
- 20 Shadow Ln
- 389 Shalom Rd
- 00 Mt Torrey Rd
- 24 Fall Ridge Dr
- 10 Fall Ridge Dr
- 13 Fall Ridge Dr
- 32 Fall Ridge Dr
- 27 Fall Ridge Dr
- 3995 Lyndhurst Rd
- 29 Fall Ridge Dr
- 38 Fall Ridge Dr
- 37 Fall Ridge Dr
- 46 Fall Ridge Dr
- 3991 Lyndhurst Rd
- 4036 Lyndhurst Rd
- 45 Fall Ridge Dr
- 3983 Lyndhurst Rd
- 54 Fall Ridge Dr
- 58 Winter Ridge Dr
- 4054 Lyndhurst Rd
- 60 Fall Ridge Dr
- 3977 Lyndhurst Rd
- 21 Schages Ln
Your Personal Tour Guide
Ask me questions while you tour the home.