Estimated Value: $617,000 - $803,000
--
Bed
--
Bath
4,006
Sq Ft
$183/Sq Ft
Est. Value
About This Home
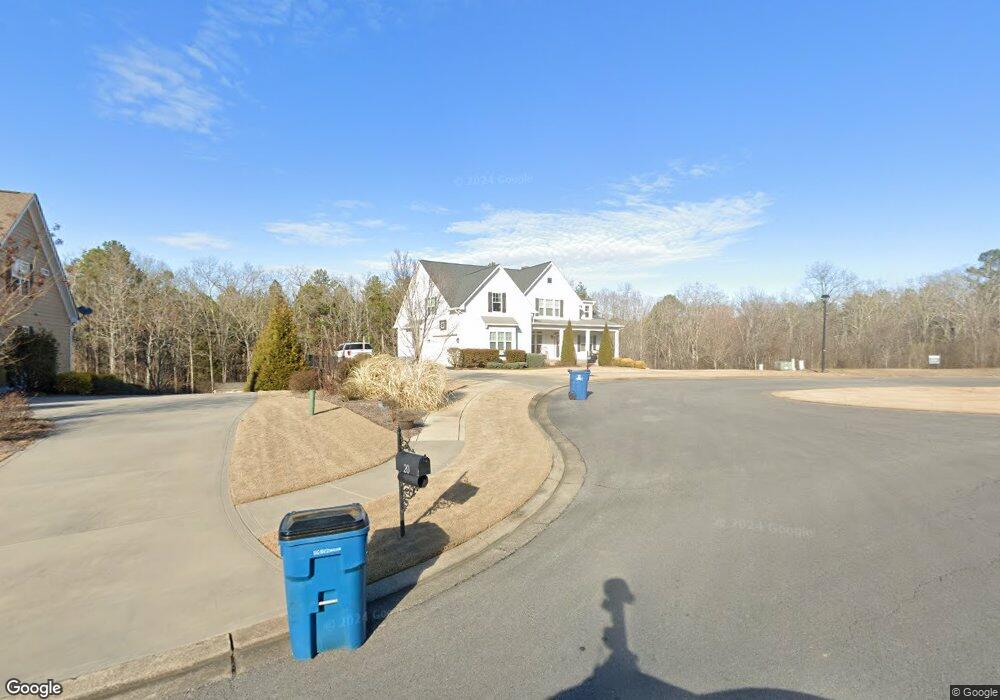
This home is located at 18 Fallen Branch Cir SE Unit 19, Rome, GA 30161 and is currently estimated at $734,166, approximately $183 per square foot. 18 Fallen Branch Cir SE Unit 19 is a home located in Floyd County with nearby schools including Model Middle School, Model High School, and Unity Christian School.
Ownership History
Date
Name
Owned For
Owner Type
Purchase Details
Closed on
Oct 28, 2022
Sold by
Naddy Timothy
Bought by
Ingram Clayton B
Current Estimated Value
Home Financials for this Owner
Home Financials are based on the most recent Mortgage that was taken out on this home.
Original Mortgage
$492,000
Outstanding Balance
$429,871
Interest Rate
6.09%
Mortgage Type
New Conventional
Estimated Equity
$304,295
Purchase Details
Closed on
Oct 26, 2017
Sold by
K C Homes Inc
Bought by
Timothy Naddy and Naddy Jennifer
Home Financials for this Owner
Home Financials are based on the most recent Mortgage that was taken out on this home.
Original Mortgage
$469,717
Interest Rate
3.83%
Mortgage Type
Purchase Money Mortgage
Purchase Details
Closed on
Mar 31, 2017
Sold by
Timothy Naddy
Bought by
K C Homes Inc
Purchase Details
Closed on
Jan 30, 2017
Sold by
North Quarters Llc
Bought by
Naddy Timothy and Naddy Jennifer
Purchase Details
Closed on
Mar 27, 2012
Sold by
Spears Brian C and Kirk Spears E
Bought by
North Quarters Llc
Create a Home Valuation Report for This Property
The Home Valuation Report is an in-depth analysis detailing your home's value as well as a comparison with similar homes in the area
Home Values in the Area
Average Home Value in this Area
Purchase History
| Date | Buyer | Sale Price | Title Company |
|---|---|---|---|
| Ingram Clayton B | $615,000 | -- | |
| Timothy Naddy | $489,813 | -- | |
| K C Homes Inc | -- | -- | |
| Naddy Timothy | $30,000 | -- | |
| North Quarters Llc | -- | -- |
Source: Public Records
Mortgage History
| Date | Status | Borrower | Loan Amount |
|---|---|---|---|
| Open | Ingram Clayton B | $492,000 | |
| Previous Owner | Timothy Naddy | $469,717 |
Source: Public Records
Tax History Compared to Growth
Tax History
| Year | Tax Paid | Tax Assessment Tax Assessment Total Assessment is a certain percentage of the fair market value that is determined by local assessors to be the total taxable value of land and additions on the property. | Land | Improvement |
|---|---|---|---|---|
| 2024 | $8,606 | $303,706 | $16,800 | $286,906 |
| 2023 | $7,386 | $295,089 | $16,800 | $278,289 |
| 2022 | $6,823 | $250,492 | $16,000 | $234,492 |
| 2021 | $6,259 | $213,138 | $16,000 | $197,138 |
| 2020 | $6,115 | $204,112 | $16,000 | $188,112 |
| 2019 | $5,949 | $201,228 | $12,000 | $189,228 |
| 2018 | $5,799 | $206,594 | $12,000 | $194,594 |
| 2017 | $301 | $10,000 | $10,000 | $0 |
| 2016 | $305 | $10,000 | $10,000 | $0 |
| 2015 | -- | $10,000 | $10,000 | $0 |
Source: Public Records
Map
Nearby Homes
- 25 Everwood Ct SE
- 21 Everwood Ct SE
- 11 Everwood Ct SE
- 9 Everwood Ct SE
- 0 Fallen Branch Cir SE Unit 10311756
- 0 Fallen Branch Cir SE Unit 10172755
- 0 Fallen Branch Cir SE Unit 7234792
- 16 Fallen Branch Cir SE
- 1 Outpost Trail SE
- 0 N Quarters Dr Unit 37 10390869
- 0 N Quarters Dr Unit 7467468
- 13 Broken Arrow Trail SE
- 38 Parkwood Cir NE
- 45 Wildflower Rd NE
- 0 Mountain Creek Dr SE Unit 10436191
- 406 Fred Kelly Rd NE
- 8 Trimble Way SE
- 158 Sproull Rd SE
- 2070 Kingston Hwy SE
- 139 Shoals Ferry Rd SE
- 18 Fallen Branch Cir SE
- 20 Fallen Branch Cir SE
- 14 Fallen Branch Cir SE
- 26 Fallen Branch Cir SE
- 22 Fallen Branch Cir SE
- 12 Fallen Branch Cir SE
- 24 Fallen Branch Cir SE
- 23 Fallen Branch Cir SE
- 10 Fallen Branch Cir SE
- 25 Fallen Branch Cir SE
- 27 Everwood Ct SE
- 27 Everwood Ct SE Unit 27
- 17 Everwood Ct SE
- 19 Everwood Ct SE
- 8 Fallen Branch Cir SE
- 15 Everwood Ct SE
- 7 Fallen Branch Cir SE
- 27 Fallen Branch Cir SE Unit 103
- 13 Everwood Ct SE
- 26 Everwood Ct SE