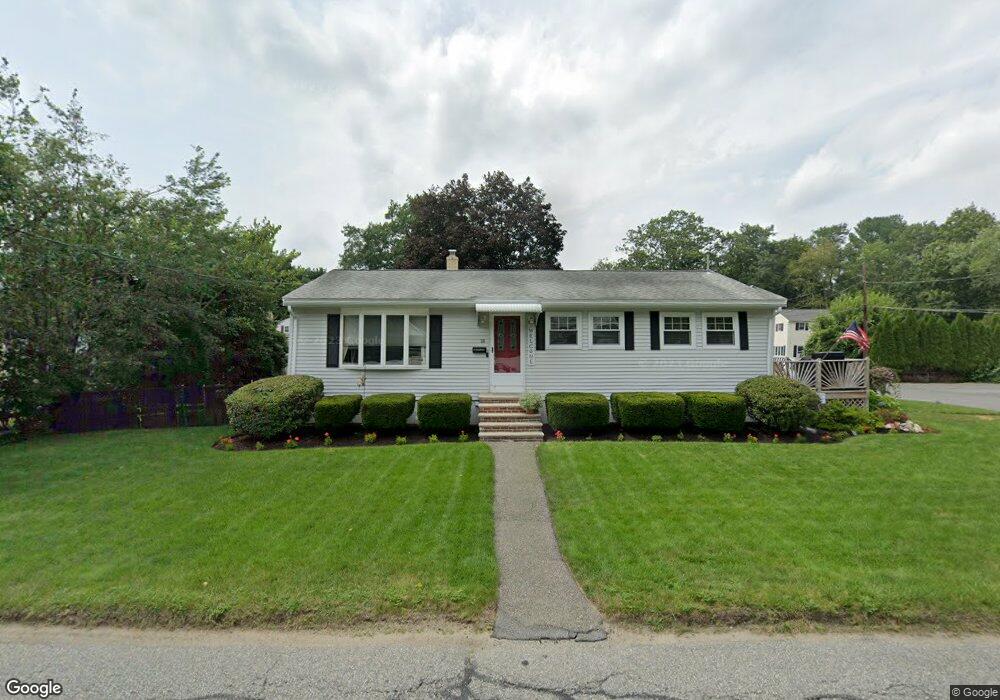
18 Faulkner Ave Wilmington, MA 01887
Estimated Value: $626,000 - $686,000
3
Beds
1
Bath
1,170
Sq Ft
$555/Sq Ft
Est. Value
About This Home
This home is located at 18 Faulkner Ave, Wilmington, MA 01887 and is currently estimated at $649,877, approximately $555 per square foot. 18 Faulkner Ave is a home located in Middlesex County with nearby schools including Wilmington Middle School, Wilmington High School, and Abundant Life Christian School and Childcare.
Ownership History
Date
Name
Owned For
Owner Type
Purchase Details
Closed on
Dec 30, 2020
Sold by
Smith Derek S and Smith Danielle
Bought by
Smith Derek S and Smith Danielle
Current Estimated Value
Home Financials for this Owner
Home Financials are based on the most recent Mortgage that was taken out on this home.
Original Mortgage
$303,000
Outstanding Balance
$269,187
Interest Rate
2.71%
Mortgage Type
New Conventional
Estimated Equity
$380,690
Purchase Details
Closed on
Sep 15, 2017
Sold by
Ella M Efraimson Ft and Little
Bought by
Smith Derek S and Giordano Danielle E
Home Financials for this Owner
Home Financials are based on the most recent Mortgage that was taken out on this home.
Original Mortgage
$314,500
Interest Rate
3.93%
Mortgage Type
New Conventional
Purchase Details
Closed on
Jul 1, 2010
Sold by
Efraimson Ella M
Bought by
Ella M Efraimson Ft and Little
Purchase Details
Closed on
May 26, 2010
Sold by
Efraimson Ft and Efraimson
Bought by
Efraimson Ella M
Purchase Details
Closed on
Aug 7, 2008
Sold by
Efraimson Ella M
Bought by
Efraimson Ft and Efraimson
Create a Home Valuation Report for This Property
The Home Valuation Report is an in-depth analysis detailing your home's value as well as a comparison with similar homes in the area
Home Values in the Area
Average Home Value in this Area
Purchase History
| Date | Buyer | Sale Price | Title Company |
|---|---|---|---|
| Smith Derek S | -- | Stewart Title | |
| Smith Derek S | $370,000 | -- | |
| Ella M Efraimson Ft | -- | -- | |
| Ella M Efraimson Ft | -- | -- | |
| Efraimson Ella M | -- | -- | |
| Efraimson Ella M | -- | -- | |
| Efraimson Ft | -- | -- | |
| Efraimson Ft | -- | -- |
Source: Public Records
Mortgage History
| Date | Status | Borrower | Loan Amount |
|---|---|---|---|
| Open | Smith Derek S | $303,000 | |
| Previous Owner | Smith Derek S | $314,500 | |
| Previous Owner | Efraimson Ft | $30,000 |
Source: Public Records
Tax History Compared to Growth
Tax History
| Year | Tax Paid | Tax Assessment Tax Assessment Total Assessment is a certain percentage of the fair market value that is determined by local assessors to be the total taxable value of land and additions on the property. | Land | Improvement |
|---|---|---|---|---|
| 2025 | $5,977 | $522,000 | $269,500 | $252,500 |
| 2024 | $5,739 | $502,100 | $269,500 | $232,600 |
| 2023 | $5,564 | $466,000 | $245,000 | $221,000 |
| 2022 | $5,424 | $416,300 | $204,100 | $212,200 |
| 2021 | $5,418 | $391,500 | $185,600 | $205,900 |
| 2020 | $5,136 | $378,200 | $185,600 | $192,600 |
| 2019 | $5,075 | $369,100 | $176,700 | $192,400 |
| 2018 | $4,711 | $326,900 | $168,300 | $158,600 |
| 2017 | $4,442 | $307,400 | $160,300 | $147,100 |
| 2016 | $4,253 | $290,700 | $152,700 | $138,000 |
| 2015 | $3,966 | $276,000 | $152,700 | $123,300 |
| 2014 | $3,684 | $258,700 | $145,400 | $113,300 |
Source: Public Records
Map
Nearby Homes