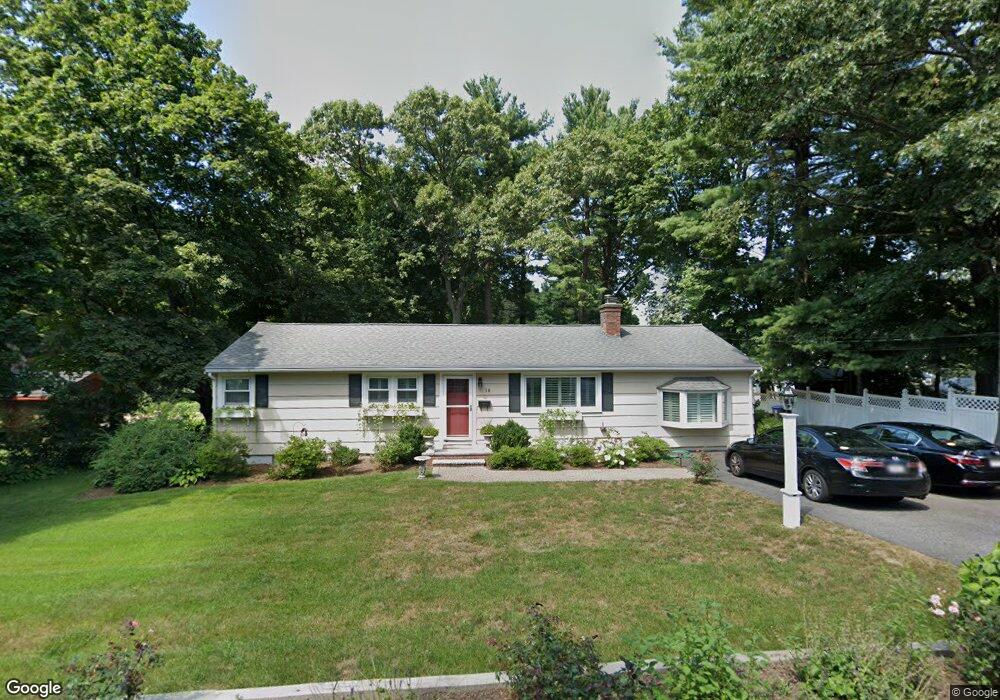
18 Felch Rd Natick, MA 01760
Estimated Value: $762,000 - $917,000
3
Beds
1
Bath
1,344
Sq Ft
$616/Sq Ft
Est. Value
About This Home
This home is located at 18 Felch Rd, Natick, MA 01760 and is currently estimated at $827,363, approximately $615 per square foot. 18 Felch Rd is a home located in Middlesex County with nearby schools including Natick High School, Bennett-Hemenway (Ben-Hem) Elementary School, and Wilson Middle School.
Ownership History
Date
Name
Owned For
Owner Type
Purchase Details
Closed on
Nov 1, 1983
Bought by
Hartelius Dorothy E
Current Estimated Value
Create a Home Valuation Report for This Property
The Home Valuation Report is an in-depth analysis detailing your home's value as well as a comparison with similar homes in the area
Home Values in the Area
Average Home Value in this Area
Purchase History
| Date | Buyer | Sale Price | Title Company |
|---|---|---|---|
| Hartelius Dorothy E | -- | -- |
Source: Public Records
Mortgage History
| Date | Status | Borrower | Loan Amount |
|---|---|---|---|
| Open | Hartelius Dorothy E | $50,000 | |
| Closed | Hartelius Dorothy E | $25,000 | |
| Closed | Hartelius Dorothy E | $55,000 |
Source: Public Records
Tax History Compared to Growth
Tax History
| Year | Tax Paid | Tax Assessment Tax Assessment Total Assessment is a certain percentage of the fair market value that is determined by local assessors to be the total taxable value of land and additions on the property. | Land | Improvement |
|---|---|---|---|---|
| 2025 | $7,718 | $645,300 | $426,200 | $219,100 |
| 2024 | $7,436 | $606,500 | $401,100 | $205,400 |
| 2023 | $7,439 | $588,500 | $386,000 | $202,500 |
| 2022 | $7,226 | $541,700 | $350,800 | $190,900 |
| 2021 | $15,815 | $508,600 | $330,800 | $177,800 |
| 2020 | $4,259 | $493,500 | $315,700 | $177,800 |
| 2019 | $7,881 | $493,500 | $315,700 | $177,800 |
| 2018 | $5,561 | $426,100 | $300,700 | $125,400 |
| 2017 | $5,113 | $379,000 | $255,900 | $123,100 |
| 2016 | $4,843 | $356,900 | $234,900 | $122,000 |
| 2015 | $4,794 | $346,900 | $234,900 | $112,000 |
Source: Public Records
Map
Nearby Homes