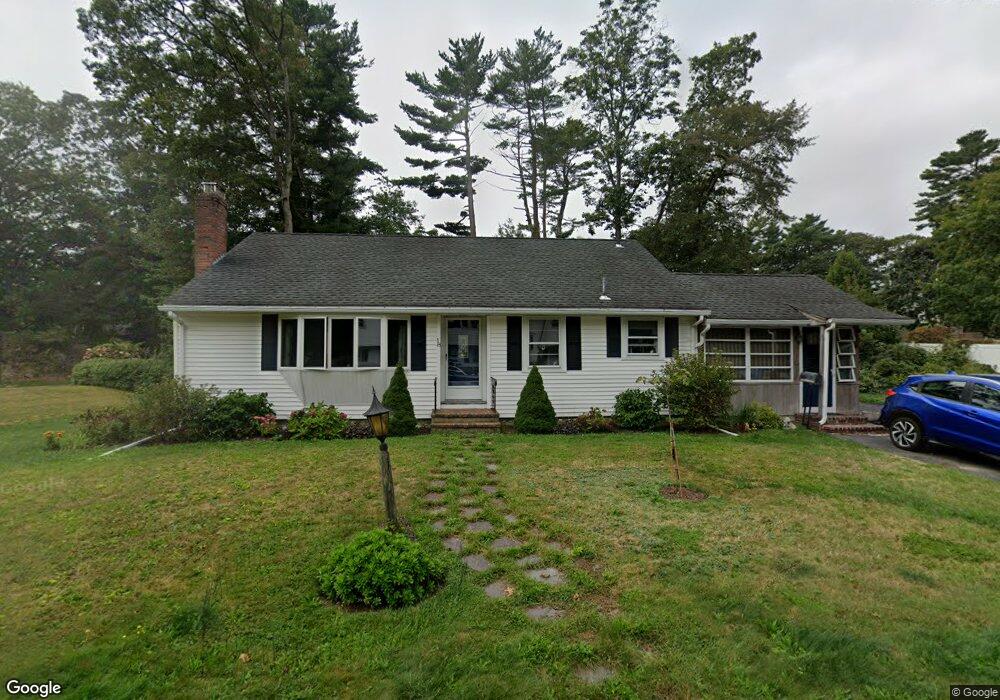
18 Fisher Rd Hingham, MA 02043
Estimated Value: $816,000 - $1,132,000
About This Home
This home is located at 18 Fisher Rd, Hingham, MA 02043 and is currently estimated at $927,703, approximately $476 per square foot. 18 Fisher Rd is a home located in Plymouth County with nearby schools including East Elementary School, Hingham Middle School, and Hingham High School.
Ownership History
We collect this data history from publicly available records. To have your information removed, we recommend requesting removal directly through your county’s website.
Purchase Details
Purchase Details
Home Financials for this Owner
Home Financials are based on the most recent Mortgage that was taken out on this home.Purchase History
We collect this data history from publicly available records. To have your information removed, we recommend requesting removal directly through your county’s website.
| Date | Buyer | Sale Price | Title Company |
|---|---|---|---|
| -- | -- | ||
| $180,000 | -- |
Mortgage History
We collect this data history from publicly available records. To have your information removed, we recommend requesting removal directly through your county’s website.
| Date | Status | Borrower | Loan Amount |
|---|---|---|---|
| Previous Owner | $25,000 | ||
| Previous Owner | $10,000 | ||
| Previous Owner | $60,000 | ||
| Previous Owner | $120,000 |
Tax History
We collect this data history from publicly available records. To have your information removed, we recommend requesting removal directly through your county’s website.
| Year | Tax Paid | Tax Assessment Tax Assessment Total Assessment is a certain percentage of the fair market value that is determined by local assessors to be the total taxable value of land and additions on the property. | Land | Improvement |
|---|---|---|---|---|
| 2025 | $7,120 | $666,000 | $326,400 | $339,600 |
| 2024 | $6,313 | $581,800 | $326,400 | $255,400 |
| 2023 | $5,299 | $529,900 | $303,100 | $226,800 |
| 2022 | $5,241 | $453,400 | $264,200 | $189,200 |
| 2021 | $5,257 | $445,500 | $264,200 | $181,300 |
| 2020 | $5,137 | $445,500 | $264,200 | $181,300 |
| 2019 | $5,156 | $436,600 | $264,200 | $172,400 |
| 2018 | $5,007 | $425,400 | $264,200 | $161,200 |
| 2017 | $4,831 | $394,400 | $265,500 | $128,900 |
| 2016 | $4,936 | $395,200 | $252,900 | $142,300 |
| 2015 | $4,586 | $366,000 | $223,700 | $142,300 |
Map
- 7 Laurel St
- 327 East St
- 200 Cushing St
- 56 Canterbury St
- 28 Lamberts Ln
- 26 Lamberts Ln
- 166 Hull St
- 18 Cedarledge Village Unit 18
- 8 Ringbolt Rd
- 108 Kilby St
- 14 Cedarledge Village
- 792 Jerusalem Rd
- 8 Evergreen Ln
- 10 Boulder Glen Rd
- 30 Diab Ln Unit 8
- 188 Forest Ave
- 33 Cedar Acres Ln
- 3 Evergreen Ln
- 9 Shore Garden Rd
- 32 Howe Rd
Ask me questions while you tour the home.