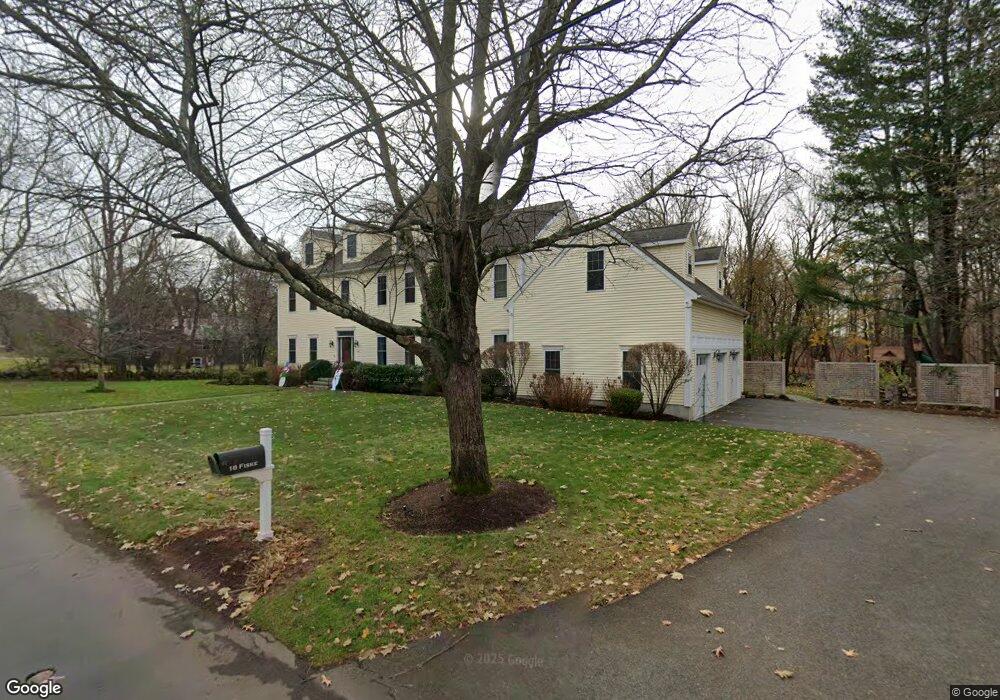
18 Fiske Rd Unit 1 Lexington, MA 02420
Countryside NeighborhoodEstimated Value: $2,138,000 - $2,671,000
3
Beds
2
Baths
1,532
Sq Ft
$1,578/Sq Ft
Est. Value
About This Home
This home is located at 18 Fiske Rd Unit 1, Lexington, MA 02420 and is currently estimated at $2,416,830, approximately $1,577 per square foot. 18 Fiske Rd Unit 1 is a home located in Middlesex County with nearby schools including Harrington Elementary School, Jonas Clarke Middle School, and Lexington High School.
Ownership History
Date
Name
Owned For
Owner Type
Purchase Details
Closed on
Dec 23, 2020
Sold by
Garson Alan and Mcneill-Garson Kelley
Bought by
Kelley M Garson T
Current Estimated Value
Purchase Details
Closed on
Jun 1, 2007
Sold by
Concord Road Rt and Ciccolo
Bought by
Garson Kelley Mcneill and Garson Alan
Purchase Details
Closed on
Oct 12, 2006
Sold by
Jerome J Joerger T J and Jerome Joerger
Bought by
Concord Road Rt and Ciccolo
Create a Home Valuation Report for This Property
The Home Valuation Report is an in-depth analysis detailing your home's value as well as a comparison with similar homes in the area
Home Values in the Area
Average Home Value in this Area
Purchase History
| Date | Buyer | Sale Price | Title Company |
|---|---|---|---|
| Kelley M Garson T | -- | None Available | |
| Kelley M Garson T M | -- | None Available | |
| Garson Kelley Mcneill | $625,000 | -- | |
| Garson Kelley Mcneill | $625,000 | -- | |
| Concord Road Rt | $580,000 | -- | |
| Concord Road Rt | $580,000 | -- |
Source: Public Records
Mortgage History
| Date | Status | Borrower | Loan Amount |
|---|---|---|---|
| Previous Owner | Concord Road Rt | $970,000 | |
| Previous Owner | Concord Road Rt | $975,000 | |
| Previous Owner | Concord Road Rt | $975,000 |
Source: Public Records
Tax History Compared to Growth
Tax History
| Year | Tax Paid | Tax Assessment Tax Assessment Total Assessment is a certain percentage of the fair market value that is determined by local assessors to be the total taxable value of land and additions on the property. | Land | Improvement |
|---|---|---|---|---|
| 2025 | $26,686 | $2,182,000 | $961,000 | $1,221,000 |
| 2024 | $26,497 | $2,163,000 | $915,000 | $1,248,000 |
| 2023 | $26,052 | $2,004,000 | $832,000 | $1,172,000 |
| 2022 | $24,412 | $1,769,000 | $757,000 | $1,012,000 |
| 2021 | $23,844 | $1,657,000 | $751,000 | $906,000 |
| 2020 | $23,140 | $1,647,000 | $751,000 | $896,000 |
| 2019 | $21,942 | $1,554,000 | $715,000 | $839,000 |
| 2018 | $21,507 | $1,504,000 | $681,000 | $823,000 |
| 2017 | $20,764 | $1,433,000 | $649,000 | $784,000 |
| 2016 | $20,615 | $1,412,000 | $618,000 | $794,000 |
| 2015 | $18,828 | $1,267,000 | $562,000 | $705,000 |
| 2014 | $18,116 | $1,168,000 | $511,000 | $657,000 |
Source: Public Records
Map
Nearby Homes