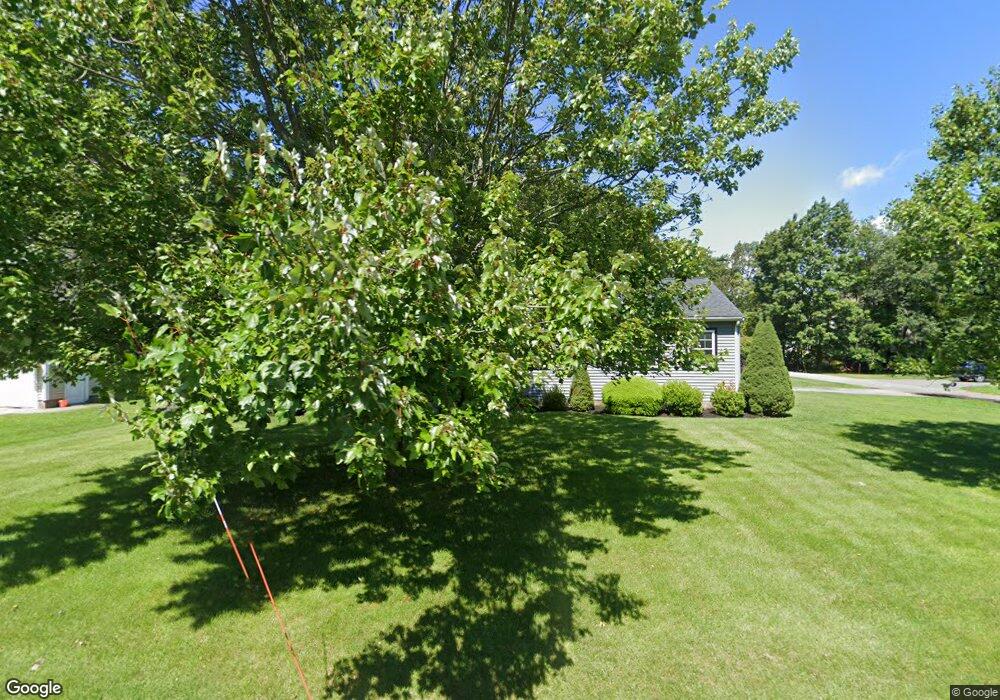
18 Floyd St Woburn, MA 01801
Walnut Hill NeighborhoodEstimated Value: $714,000 - $832,000
3
Beds
2
Baths
1,597
Sq Ft
$486/Sq Ft
Est. Value
About This Home
This home is located at 18 Floyd St, Woburn, MA 01801 and is currently estimated at $776,609, approximately $486 per square foot. 18 Floyd St is a home located in Middlesex County with nearby schools including Goodyear Elementary School, John F. Kennedy Middle School, and Woburn High School.
Ownership History
Date
Name
Owned For
Owner Type
Purchase Details
Closed on
Jan 27, 1998
Sold by
Severance Marion A
Bought by
Turner Paul H and Turner Amy G
Current Estimated Value
Home Financials for this Owner
Home Financials are based on the most recent Mortgage that was taken out on this home.
Original Mortgage
$100,000
Interest Rate
7.11%
Mortgage Type
Purchase Money Mortgage
Create a Home Valuation Report for This Property
The Home Valuation Report is an in-depth analysis detailing your home's value as well as a comparison with similar homes in the area
Home Values in the Area
Average Home Value in this Area
Purchase History
| Date | Buyer | Sale Price | Title Company |
|---|---|---|---|
| Turner Paul H | $150,000 | -- |
Source: Public Records
Mortgage History
| Date | Status | Borrower | Loan Amount |
|---|---|---|---|
| Open | Turner Paul H | $248,000 | |
| Closed | Turner Paul H | $18,000 | |
| Closed | Turner Paul H | $100,000 | |
| Previous Owner | Turner Paul H | $146,200 |
Source: Public Records
Tax History
| Year | Tax Paid | Tax Assessment Tax Assessment Total Assessment is a certain percentage of the fair market value that is determined by local assessors to be the total taxable value of land and additions on the property. | Land | Improvement |
|---|---|---|---|---|
| 2025 | $5,595 | $655,200 | $335,800 | $319,400 |
| 2024 | $5,152 | $639,200 | $319,800 | $319,400 |
| 2023 | $5,196 | $597,200 | $290,800 | $306,400 |
| 2022 | $5,076 | $543,500 | $253,000 | $290,500 |
| 2021 | $4,781 | $512,400 | $241,000 | $271,400 |
| 2020 | $4,464 | $479,000 | $241,000 | $238,000 |
| 2019 | $4,280 | $450,500 | $229,600 | $220,900 |
| 2018 | $4,127 | $417,300 | $210,700 | $206,600 |
| 2017 | $3,985 | $400,900 | $200,800 | $200,100 |
| 2016 | $3,816 | $379,700 | $187,700 | $192,000 |
| 2015 | $3,671 | $361,000 | $175,500 | $185,500 |
| 2014 | $3,414 | $327,000 | $175,500 | $151,500 |
Source: Public Records
Map
Nearby Homes
- 16 Felton St
- 18 Central St
- 6 Stratton Dr Unit 3303
- 6 Stratton Dr Unit 208
- 6 Stratton Dr Unit 3307
- 31 Tremont St
- 100 Ledgewood Dr Unit 410
- 200 Ledgewood Dr Unit 601
- 1 Alden Ave
- 2 Mason Way Unit 6524
- 6 Mason Way Unit 63
- 10 Rodgers Rd
- 23 Sunrise Ave
- 21 Eastern Ave
- 57 Park St
- 39 Jefferson Ave
- 3 Golden Terrace
- 146 Marble St Unit 507
- 159 Main St Unit 27C
- 159 Main St Unit 39A
Your Personal Tour Guide
Ask me questions while you tour the home.