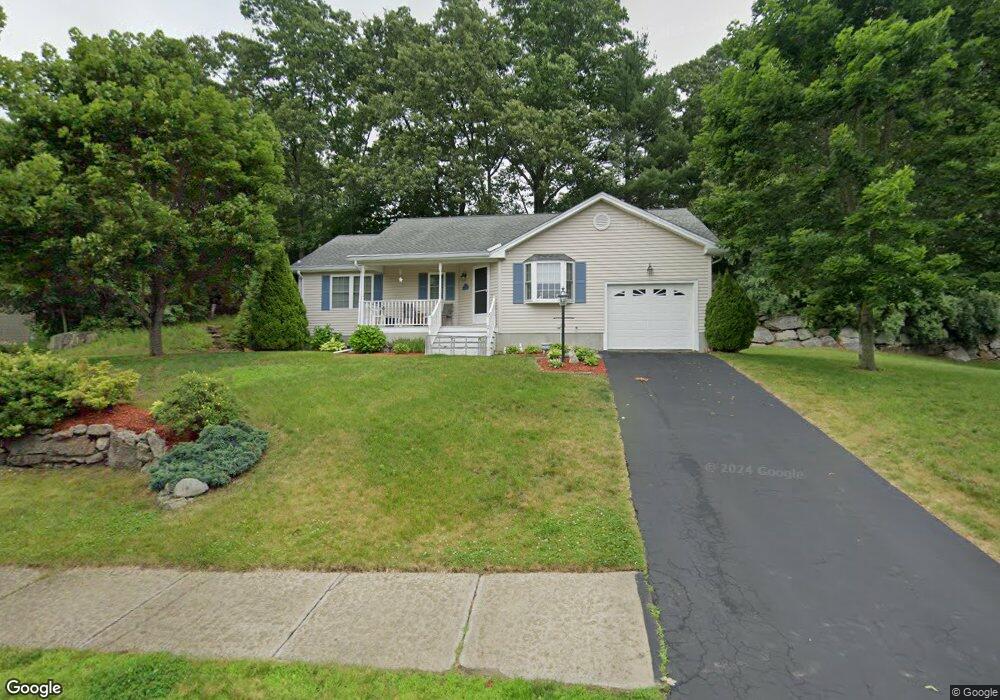
18 Fox Run Cir Auburn, MA 01501
Pondville NeighborhoodEstimated Value: $451,744 - $544,000
2
Beds
2
Baths
1,239
Sq Ft
$403/Sq Ft
Est. Value
About This Home
This home is located at 18 Fox Run Cir, Auburn, MA 01501 and is currently estimated at $499,436, approximately $403 per square foot. 18 Fox Run Cir is a home located in Worcester County with nearby schools including Auburn Senior High School and Shrewsbury Montessori School - Auburn Campus.
Ownership History
Date
Name
Owned For
Owner Type
Purchase Details
Closed on
Jul 29, 2008
Sold by
Creelman Dorothy J and Richardson Laurie
Bought by
Howarth Deborah R and Howarth Richard G
Current Estimated Value
Home Financials for this Owner
Home Financials are based on the most recent Mortgage that was taken out on this home.
Original Mortgage
$184,000
Outstanding Balance
$120,883
Interest Rate
6.35%
Mortgage Type
Purchase Money Mortgage
Estimated Equity
$378,553
Purchase Details
Closed on
Jul 19, 2000
Sold by
New Birchwood I Corp
Bought by
Creelman Robert H and Creelman Dorothy J
Create a Home Valuation Report for This Property
The Home Valuation Report is an in-depth analysis detailing your home's value as well as a comparison with similar homes in the area
Home Values in the Area
Average Home Value in this Area
Purchase History
| Date | Buyer | Sale Price | Title Company |
|---|---|---|---|
| Howarth Deborah R | $230,000 | -- | |
| Creelman Robert H | $186,750 | -- |
Source: Public Records
Mortgage History
| Date | Status | Borrower | Loan Amount |
|---|---|---|---|
| Open | Howarth Deborah R | $184,000 |
Source: Public Records
Tax History
| Year | Tax Paid | Tax Assessment Tax Assessment Total Assessment is a certain percentage of the fair market value that is determined by local assessors to be the total taxable value of land and additions on the property. | Land | Improvement |
|---|---|---|---|---|
| 2025 | $57 | $396,000 | $114,500 | $281,500 |
| 2024 | $5,593 | $374,600 | $108,900 | $265,700 |
| 2023 | $5,383 | $339,000 | $99,000 | $240,000 |
| 2022 | $4,994 | $296,900 | $99,000 | $197,900 |
| 2021 | $4,745 | $261,600 | $87,400 | $174,200 |
| 2020 | $4,704 | $261,600 | $87,400 | $174,200 |
| 2019 | $4,693 | $254,800 | $86,500 | $168,300 |
| 2018 | $4,424 | $239,900 | $80,900 | $159,000 |
| 2017 | $4,260 | $232,300 | $73,300 | $159,000 |
| 2016 | $4,105 | $226,900 | $77,000 | $149,900 |
| 2015 | $3,975 | $230,300 | $77,000 | $153,300 |
| 2014 | $3,740 | $216,300 | $73,300 | $143,000 |
Source: Public Records
Map
Nearby Homes
- 6 George St
- 61 School St
- 137 South St
- 8 South Terrace
- 751 Washington St Unit 43A
- 36 Central St
- 634 Oxford St S
- 166 Leicester St
- 303 W Main St
- 35 Waterman Rd
- 49 Prospect St
- 33 Eastford Rd
- 328 Oxford St N
- 31 Walsh Ave
- 31-33 Walsh Ave
- 33 Walsh Ave
- 808 Washington St
- 40 Bryn Mawr Ave
- 0 Athens St
- 4 Athens St
Your Personal Tour Guide
Ask me questions while you tour the home.