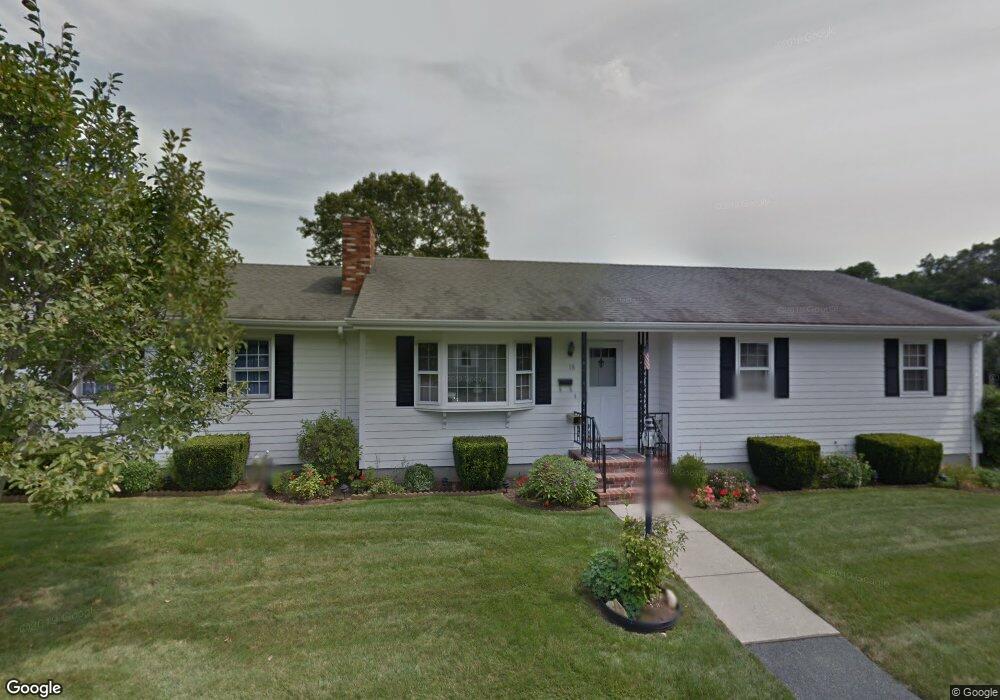
18 Frank St Acushnet, MA 02743
Upper Acushnet NeighborhoodEstimated Value: $405,000 - $625,000
--
Bed
1
Bath
2,628
Sq Ft
$207/Sq Ft
Est. Value
About This Home
This home is located at 18 Frank St, Acushnet, MA 02743 and is currently estimated at $544,241, approximately $207 per square foot. 18 Frank St is a home located in Bristol County with nearby schools including Acushnet Elementary School, Albert F Ford Middle School, and Alma Del Mar Charter School.
Ownership History
Date
Name
Owned For
Owner Type
Purchase Details
Closed on
Mar 4, 2022
Sold by
Carvalho Margarida and Carvalho Mario G
Bought by
Mario G Carvalho 2013 T G and Mario Carvalho
Current Estimated Value
Purchase Details
Closed on
Aug 23, 2019
Sold by
Carvalho Ft and Carvalho
Bought by
Carvalho Mario G and Carvalho George
Purchase Details
Closed on
Jul 16, 2004
Sold by
Carvalho Eulalia C
Bought by
Carvalho Ft and Carvalho
Purchase Details
Closed on
May 26, 2004
Sold by
Carvalho Eulalia C and Carvalho Horacio S
Bought by
Carvalho Eulalia C
Purchase Details
Closed on
Dec 30, 2003
Sold by
Carvalho Ft and Carvalho
Bought by
Carvalho Ft and Carvalho
Create a Home Valuation Report for This Property
The Home Valuation Report is an in-depth analysis detailing your home's value as well as a comparison with similar homes in the area
Home Values in the Area
Average Home Value in this Area
Purchase History
| Date | Buyer | Sale Price | Title Company |
|---|---|---|---|
| Mario G Carvalho 2013 T G | -- | None Available | |
| Mario G Carvalho 2013 T G | -- | None Available | |
| Carvalho Mario G | $210,000 | -- | |
| Carvalho Mario G | $210,000 | -- | |
| Carvalho Mario G | $210,000 | -- | |
| Carvalho Ft | -- | -- | |
| Carvalho Ft | -- | -- | |
| Carvalho Eulalia C | -- | -- | |
| Carvalho Eulalia C | -- | -- | |
| Carvalho Manuel H | -- | -- | |
| Carvalho Eulalia C | -- | -- | |
| Carvalho Ft | -- | -- | |
| Carvalho Ft | -- | -- |
Source: Public Records
Mortgage History
| Date | Status | Borrower | Loan Amount |
|---|---|---|---|
| Previous Owner | Carvalho Ft | $5,128 |
Source: Public Records
Tax History Compared to Growth
Tax History
| Year | Tax Paid | Tax Assessment Tax Assessment Total Assessment is a certain percentage of the fair market value that is determined by local assessors to be the total taxable value of land and additions on the property. | Land | Improvement |
|---|---|---|---|---|
| 2025 | $4,887 | $452,900 | $122,500 | $330,400 |
| 2024 | $4,570 | $400,500 | $116,000 | $284,500 |
| 2023 | $4,416 | $368,000 | $105,300 | $262,700 |
| 2022 | $4,407 | $332,100 | $98,800 | $233,300 |
| 2021 | $3,759 | $271,800 | $98,800 | $173,000 |
| 2020 | $3,700 | $265,400 | $92,400 | $173,000 |
| 2019 | $3,549 | $250,300 | $88,100 | $162,200 |
| 2018 | $2,901 | $238,000 | $88,100 | $149,900 |
| 2017 | $3,331 | $230,700 | $88,100 | $142,600 |
| 2016 | $3,239 | $222,900 | $88,100 | $134,800 |
| 2015 | $3,073 | $215,200 | $88,100 | $127,100 |
Source: Public Records
Map
Nearby Homes