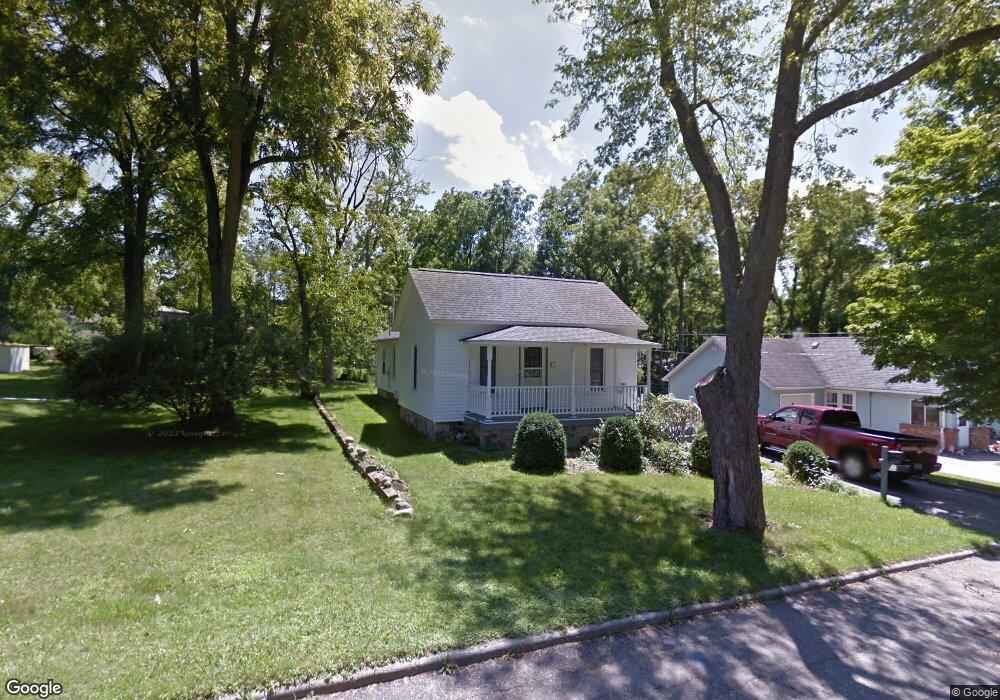
18 Frisbie St Hillsdale, MI 49242
Estimated Value: $181,000 - $188,000
3
Beds
1
Bath
1,672
Sq Ft
$110/Sq Ft
Est. Value
About This Home
This home is located at 18 Frisbie St, Hillsdale, MI 49242 and is currently estimated at $183,581, approximately $109 per square foot. 18 Frisbie St is a home located in Hillsdale County with nearby schools including Bailey Early Childhood Center, Gier Elementary School, and Davis Middle School.
Ownership History
Date
Name
Owned For
Owner Type
Purchase Details
Closed on
Dec 24, 2009
Sold by
Thomson Linda M and Coombs Jean A
Bought by
Thomson Linda M and Coombs Jean A
Current Estimated Value
Purchase Details
Closed on
Apr 17, 2009
Sold by
Mortgage Electronic Registration Systems
Bought by
U S Bank National Association
Purchase Details
Closed on
Feb 6, 2009
Sold by
Prendergast Albert G and Prendergast Jociel C
Bought by
Mortgage Electronic Registration Systems
Purchase Details
Closed on
Feb 16, 2001
Sold by
Davis Paul and Davis Mary
Bought by
Prendergast Albert G and Prendergast Jociel C
Purchase Details
Closed on
Nov 30, 1998
Sold by
Eppel Steven and Eppel Deborah
Bought by
Davis Paul and Davis Mary
Purchase Details
Closed on
Oct 22, 1996
Sold by
Hart Ronald and Hart Thelma
Bought by
Eppel Steven and Eppel Deborah
Create a Home Valuation Report for This Property
The Home Valuation Report is an in-depth analysis detailing your home's value as well as a comparison with similar homes in the area
Home Values in the Area
Average Home Value in this Area
Purchase History
| Date | Buyer | Sale Price | Title Company |
|---|---|---|---|
| Thomson Linda M | -- | None Available | |
| U S Bank National Association | -- | None Available | |
| Mortgage Electronic Registration Systems | $83,149 | None Available | |
| Prendergast Albert G | $78,500 | -- | |
| Davis Paul | $66,000 | -- | |
| Eppel Steven | $36,000 | -- |
Source: Public Records
Tax History Compared to Growth
Tax History
| Year | Tax Paid | Tax Assessment Tax Assessment Total Assessment is a certain percentage of the fair market value that is determined by local assessors to be the total taxable value of land and additions on the property. | Land | Improvement |
|---|---|---|---|---|
| 2025 | $2,488 | $69,600 | $0 | $0 |
| 2024 | $1,834 | $64,400 | $0 | $0 |
| 2023 | $1,764 | $45,900 | $0 | $0 |
| 2022 | $2,283 | $46,000 | $0 | $0 |
| 2021 | $2,231 | $42,400 | $0 | $0 |
| 2020 | $2,174 | $40,000 | $0 | $0 |
| 2019 | $2,120 | $48,500 | $0 | $0 |
| 2018 | $2,007 | $38,600 | $0 | $0 |
| 2017 | $1,948 | $36,100 | $0 | $0 |
| 2016 | $1,829 | $33,800 | $0 | $0 |
| 2015 | $1,316 | $33,800 | $0 | $0 |
| 2013 | -- | $36,010 | $0 | $0 |
| 2012 | -- | $35,680 | $0 | $0 |
Source: Public Records
Map
Nearby Homes