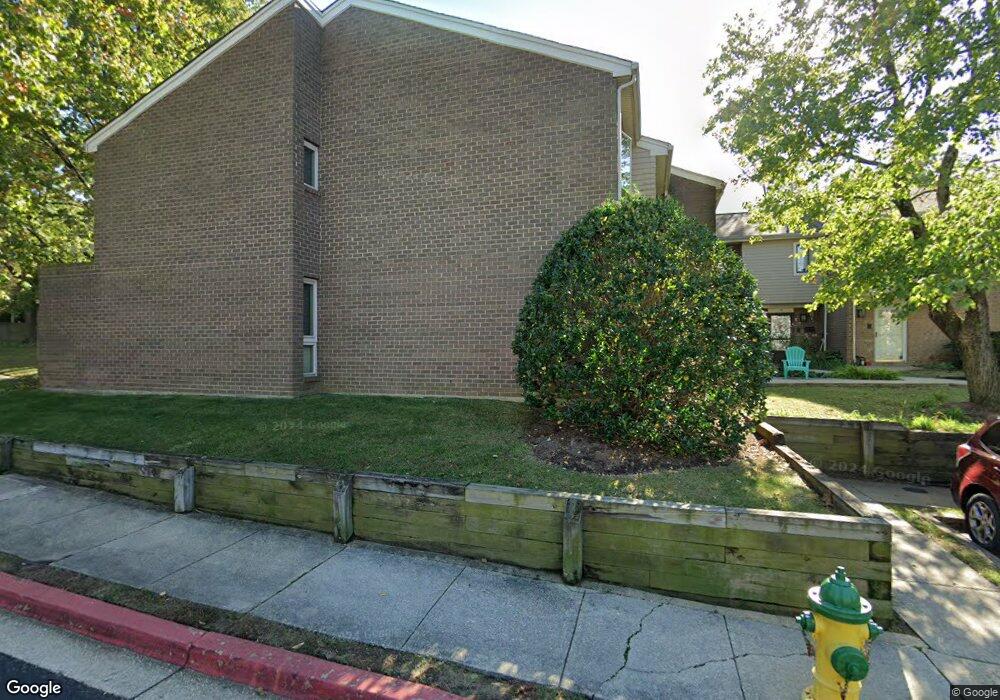
18 Gentry Ct Annapolis, MD 21403
Tyler Heights-Primrose Acres NeighborhoodEstimated Value: $358,796 - $392,000
3
Beds
3
Baths
1,460
Sq Ft
$254/Sq Ft
Est. Value
About This Home
This home is located at 18 Gentry Ct, Annapolis, MD 21403 and is currently estimated at $371,199, approximately $254 per square foot. 18 Gentry Ct is a home located in Anne Arundel County with nearby schools including Germantown Elementary School, Wiley H. Bates Middle School, and Annapolis High School.
Ownership History
Date
Name
Owned For
Owner Type
Purchase Details
Closed on
Feb 25, 2011
Sold by
Powell Mary S
Bought by
Myers John N and Buter Jennifer L
Current Estimated Value
Home Financials for this Owner
Home Financials are based on the most recent Mortgage that was taken out on this home.
Original Mortgage
$236,711
Outstanding Balance
$158,839
Interest Rate
4.3%
Mortgage Type
FHA
Estimated Equity
$212,360
Purchase Details
Closed on
Nov 2, 2010
Sold by
Powell Mary S
Bought by
Myers John N and Buter Jennifer L
Home Financials for this Owner
Home Financials are based on the most recent Mortgage that was taken out on this home.
Original Mortgage
$236,711
Interest Rate
4.3%
Mortgage Type
FHA
Purchase Details
Closed on
Dec 10, 1985
Bought by
Powell Mary S
Home Financials for this Owner
Home Financials are based on the most recent Mortgage that was taken out on this home.
Original Mortgage
$50,000
Interest Rate
11.5%
Create a Home Valuation Report for This Property
The Home Valuation Report is an in-depth analysis detailing your home's value as well as a comparison with similar homes in the area
Home Values in the Area
Average Home Value in this Area
Purchase History
| Date | Buyer | Sale Price | Title Company |
|---|---|---|---|
| Myers John N | $239,900 | -- | |
| Myers John N | $239,900 | -- | |
| Powell Mary S | $74,000 | -- |
Source: Public Records
Mortgage History
| Date | Status | Borrower | Loan Amount |
|---|---|---|---|
| Open | Myers John N | $236,711 | |
| Previous Owner | Myers John N | $236,711 | |
| Previous Owner | Powell Mary S | $50,000 |
Source: Public Records
Tax History
| Year | Tax Paid | Tax Assessment Tax Assessment Total Assessment is a certain percentage of the fair market value that is determined by local assessors to be the total taxable value of land and additions on the property. | Land | Improvement |
|---|---|---|---|---|
| 2025 | $3,683 | $277,933 | -- | -- |
| 2024 | $3,683 | $263,867 | $0 | $0 |
| 2023 | $3,532 | $249,800 | $120,000 | $129,800 |
| 2022 | $3,375 | $242,067 | $0 | $0 |
| 2021 | $3,195 | $234,333 | $0 | $0 |
| 2020 | $3,195 | $226,600 | $110,000 | $116,600 |
| 2019 | $3,191 | $226,167 | $0 | $0 |
| 2018 | $3,140 | $225,733 | $0 | $0 |
| 2017 | $2,940 | $225,300 | $0 | $0 |
| 2016 | -- | $222,900 | $0 | $0 |
| 2015 | -- | $220,500 | $0 | $0 |
| 2014 | -- | $218,100 | $0 | $0 |
Source: Public Records
Map
Nearby Homes
- 19 Spindrift Way
- 8 Wellington Place
- 1436 Regent St
- 4 Boxwood Rd
- 1240 Gemini Dr
- 300 Hilltop Ln Unit 300B
- 300 Hilltop Ln Unit 300I
- 300 Hilltop Ln Unit H
- 908 Spa Rd
- 637 Chase St
- 1029 Smithville St
- 102 Vanguard Ln
- 1233 Gemini Dr Unit C
- 709 Skippers Ln
- 116 Academy St
- 1403 Corey Ln
- 1608 Belle Dr
- 13 German St
- 1201 West St
- 1808 Lincoln Dr
Your Personal Tour Guide
Ask me questions while you tour the home.