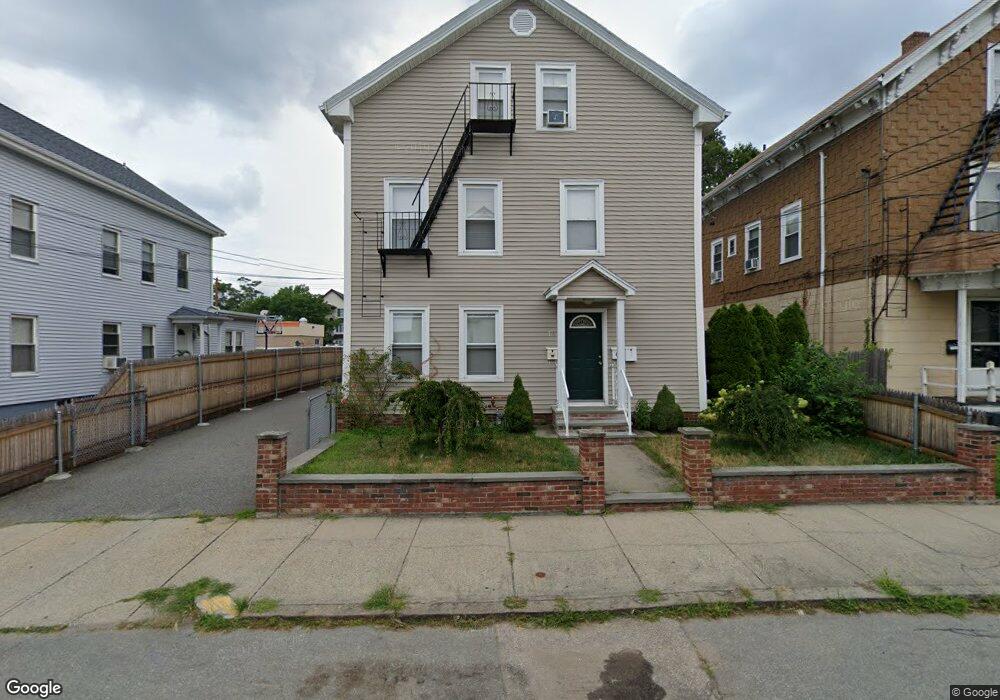
18 Gooding St Pawtucket, RI 02860
Pleasant View NeighborhoodEstimated Value: $523,000 - $630,000
4
Beds
2
Baths
1,998
Sq Ft
$291/Sq Ft
Est. Value
About This Home
This home is located at 18 Gooding St, Pawtucket, RI 02860 and is currently estimated at $581,000, approximately $290 per square foot. 18 Gooding St is a home located in Providence County with nearby schools including St Cecilia School and Saint Raphael Academy.
Ownership History
Date
Name
Owned For
Owner Type
Purchase Details
Closed on
Feb 28, 2017
Sold by
Soares Paul J
Bought by
Sores Family Llc
Current Estimated Value
Purchase Details
Closed on
Oct 7, 1997
Sold by
Davidson Robert Scott
Bought by
Cabral Lidia D
Home Financials for this Owner
Home Financials are based on the most recent Mortgage that was taken out on this home.
Original Mortgage
$44,000
Interest Rate
7.41%
Purchase Details
Closed on
Dec 18, 1989
Sold by
Olyott E W Est
Bought by
Adamo Ronald
Home Financials for this Owner
Home Financials are based on the most recent Mortgage that was taken out on this home.
Original Mortgage
$100,000
Interest Rate
9.73%
Create a Home Valuation Report for This Property
The Home Valuation Report is an in-depth analysis detailing your home's value as well as a comparison with similar homes in the area
Home Values in the Area
Average Home Value in this Area
Purchase History
| Date | Buyer | Sale Price | Title Company |
|---|---|---|---|
| Sores Family Llc | -- | -- | |
| Cabral Lidia D | $55,000 | -- | |
| Adamo Ronald | $100,000 | -- |
Source: Public Records
Mortgage History
| Date | Status | Borrower | Loan Amount |
|---|---|---|---|
| Previous Owner | Adamo Ronald | $109,000 | |
| Previous Owner | Adamo Ronald | $44,000 | |
| Previous Owner | Adamo Ronald | $100,000 |
Source: Public Records
Tax History Compared to Growth
Tax History
| Year | Tax Paid | Tax Assessment Tax Assessment Total Assessment is a certain percentage of the fair market value that is determined by local assessors to be the total taxable value of land and additions on the property. | Land | Improvement |
|---|---|---|---|---|
| 2025 | $5,971 | $454,100 | $127,400 | $326,700 |
| 2024 | $5,604 | $454,100 | $127,400 | $326,700 |
| 2023 | $4,503 | $265,800 | $64,000 | $201,800 |
| 2022 | $4,407 | $265,800 | $64,000 | $201,800 |
| 2021 | $4,407 | $265,800 | $64,000 | $201,800 |
| 2020 | $3,528 | $168,900 | $47,200 | $121,700 |
| 2019 | $3,528 | $168,900 | $47,200 | $121,700 |
| 2018 | $3,400 | $168,900 | $47,200 | $121,700 |
| 2017 | $3,419 | $150,500 | $41,000 | $109,500 |
| 2016 | $3,294 | $150,500 | $41,000 | $109,500 |
| 2015 | $3,294 | $150,500 | $41,000 | $109,500 |
| 2014 | $2,645 | $114,700 | $41,000 | $73,700 |
Source: Public Records
Map
Nearby Homes
- 29 Woodbine St Unit 6
- 50 Carnation St Unit 2
- 300 Front St Unit 105
- 39 Webster St Unit 204
- 27 Collins Ave
- 511 High St
- 517 High St
- 211 Carnation St
- 168 Central Ave
- 176 Central Ave
- 54 Sabin St
- 30 Foundry St Unit 6
- 396 Roosevelt Ave
- 147 Coyle Ave
- 116 Foundry St
- 0 New Haven St
- 234 Central St Unit 236
- 79 Turner St
- 1 Allenson Ave
- 19 Wood St