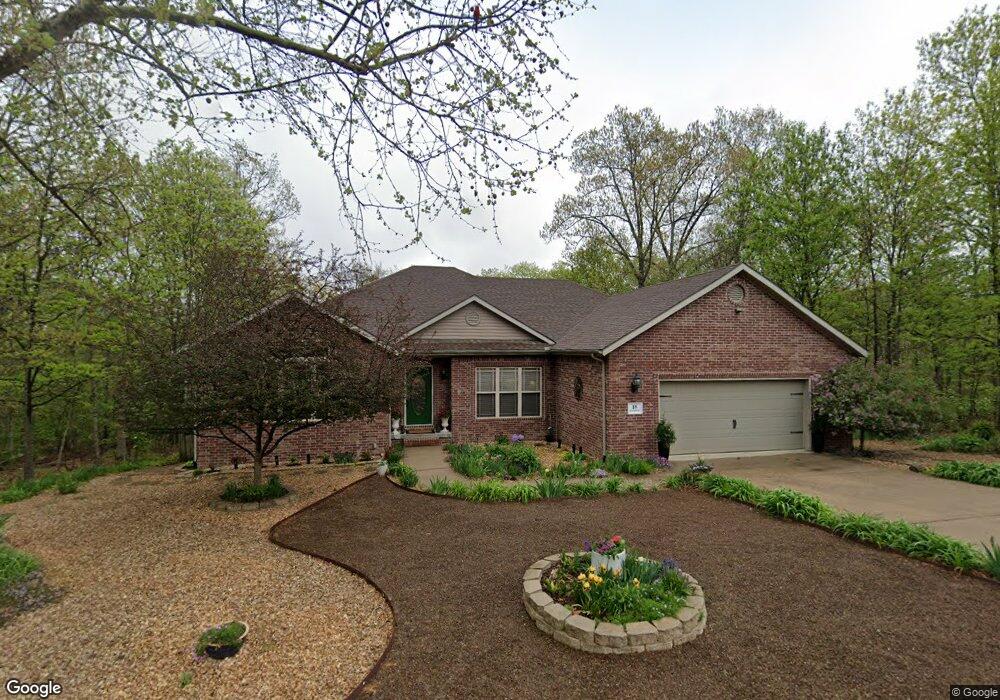
18 Granshire Dr Bella Vista, AR 72714
Estimated Value: $435,000 - $471,075
3
Beds
3
Baths
2,322
Sq Ft
$193/Sq Ft
Est. Value
About This Home
This home is located at 18 Granshire Dr, Bella Vista, AR 72714 and is currently estimated at $447,519, approximately $192 per square foot. 18 Granshire Dr is a home located in Benton County with nearby schools including Cooper Elementary School, Old High Middle School, and Washington Junior High School.
Ownership History
Date
Name
Owned For
Owner Type
Purchase Details
Closed on
Mar 13, 2008
Sold by
Relocation Advantage Llc
Bought by
Schuster Robert and Schuster Dorothy L
Current Estimated Value
Home Financials for this Owner
Home Financials are based on the most recent Mortgage that was taken out on this home.
Original Mortgage
$106,500
Outstanding Balance
$67,633
Interest Rate
6.19%
Mortgage Type
Purchase Money Mortgage
Estimated Equity
$379,886
Purchase Details
Closed on
Feb 28, 2008
Sold by
Cantu Albert L and Cantu Irma G
Bought by
Relocation Advantage Llc
Home Financials for this Owner
Home Financials are based on the most recent Mortgage that was taken out on this home.
Original Mortgage
$106,500
Outstanding Balance
$67,633
Interest Rate
6.19%
Mortgage Type
Purchase Money Mortgage
Estimated Equity
$379,886
Purchase Details
Closed on
May 27, 2004
Bought by
Cantu
Purchase Details
Closed on
May 5, 2003
Bought by
Nickel Homes
Purchase Details
Closed on
Nov 8, 1984
Bought by
Weaver
Create a Home Valuation Report for This Property
The Home Valuation Report is an in-depth analysis detailing your home's value as well as a comparison with similar homes in the area
Home Values in the Area
Average Home Value in this Area
Purchase History
| Date | Buyer | Sale Price | Title Company |
|---|---|---|---|
| Schuster Robert | $187,000 | None Available | |
| Relocation Advantage Llc | -- | None Available | |
| Cantu | $200,000 | -- | |
| Cantu | $200,000 | -- | |
| Nickel Homes | $5,000 | -- | |
| Weaver | $4,000 | -- |
Source: Public Records
Mortgage History
| Date | Status | Borrower | Loan Amount |
|---|---|---|---|
| Open | Schuster Robert | $106,500 | |
| Closed | Relocation Advantage Llc | $106,500 |
Source: Public Records
Tax History Compared to Growth
Tax History
| Year | Tax Paid | Tax Assessment Tax Assessment Total Assessment is a certain percentage of the fair market value that is determined by local assessors to be the total taxable value of land and additions on the property. | Land | Improvement |
|---|---|---|---|---|
| 2025 | $2,315 | $82,173 | $1,600 | $80,573 |
| 2024 | $2,291 | $82,173 | $1,600 | $80,573 |
| 2023 | $2,291 | $53,730 | $800 | $52,930 |
| 2022 | $1,990 | $53,730 | $800 | $52,930 |
| 2021 | $1,985 | $53,730 | $800 | $52,930 |
| 2020 | $2,006 | $39,950 | $600 | $39,350 |
| 2019 | $2,006 | $39,950 | $600 | $39,350 |
| 2018 | $2,031 | $39,950 | $600 | $39,350 |
| 2017 | $1,941 | $39,950 | $600 | $39,350 |
| 2016 | $1,941 | $39,950 | $600 | $39,350 |
| 2015 | $2,238 | $37,120 | $1,000 | $36,120 |
| 2014 | $1,888 | $37,120 | $1,000 | $36,120 |
Source: Public Records
Map
Nearby Homes
- 1 Portland Cir
- 3 Embleton Cir
- 0 N Embleton Ln Unit 1327593
- 27 Aveton Ln
- Lot 9 Embleton Dr
- 6 Marionet Cir
- 35 Harborough Dr
- Lot 24 Block 3 Pennine Ln
- 0 Modbury Cir
- 62 Dickenshire Dr
- 8 Haddon Ln
- Lot 11 Dickenshire Dr
- 21 Newhaven Ln
- 67 Fairway Dr
- 0 Brighton Dr
- 8 Petworth Ln
- 0 Granshire Dr Unit 1322014
- 18 Caxton Ln
- 9 Lunsford Ln
- 17 Duxford Cir
- L21 Petherton
- 5 N Brent Ln
- 0 Petherton Cir Unit 717157
- 7 N Brent Ln
- Lot 21 Petherton Cir
- 3 N Brent Ln
- 9 N Brent Ln
- 17 Granshire Dr
- 23 Granshire Dr
- 1 N Brent Ln
- 2 Petherton Cir
- 24 Granshire Dr
- 0 N Brent Ln
- 1 Embleton Dr
- 1 Embleton Dr
- 11 N Brent Ln
- 0 Buckfast Ln Unit 719654
- 1 Elder Ln
- 15 Granshire Dr
- 8 N Brent Ln