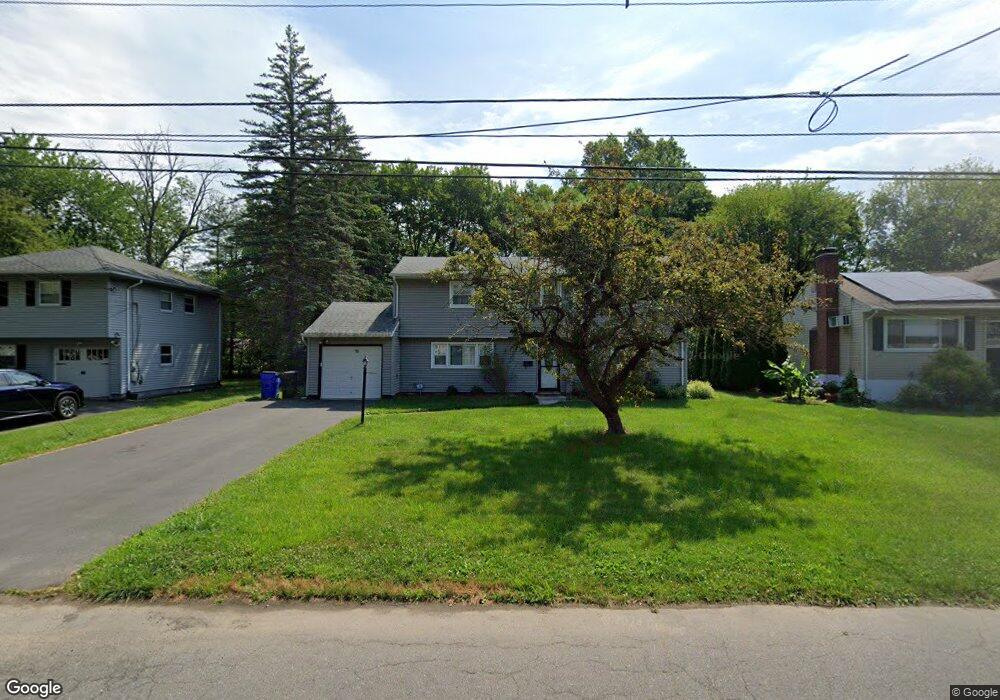
18 Greenbrier Dr West Hartford, CT 06117
Estimated Value: $386,034 - $424,000
3
Beds
2
Baths
1,054
Sq Ft
$384/Sq Ft
Est. Value
About This Home
This home is located at 18 Greenbrier Dr, West Hartford, CT 06117 and is currently estimated at $405,259, approximately $384 per square foot. 18 Greenbrier Dr is a home located in Hartford County with nearby schools including Aiken School, King Philip Middle School, and Delta High School.
Ownership History
Date
Name
Owned For
Owner Type
Purchase Details
Closed on
May 17, 2022
Sold by
Holmes Stanley
Bought by
Holmes Raynette
Current Estimated Value
Home Financials for this Owner
Home Financials are based on the most recent Mortgage that was taken out on this home.
Original Mortgage
$162,171
Outstanding Balance
$153,303
Interest Rate
4.72%
Mortgage Type
FHA
Estimated Equity
$251,956
Purchase Details
Closed on
May 5, 2022
Sold by
Holmes Stanley
Bought by
Holmes Raynette
Home Financials for this Owner
Home Financials are based on the most recent Mortgage that was taken out on this home.
Original Mortgage
$162,171
Outstanding Balance
$153,303
Interest Rate
4.72%
Mortgage Type
FHA
Estimated Equity
$251,956
Purchase Details
Closed on
Nov 3, 1997
Sold by
Cohen Arthur and Cohen Irene S
Bought by
Holmes Stanley and Holmes Raynette
Home Financials for this Owner
Home Financials are based on the most recent Mortgage that was taken out on this home.
Original Mortgage
$121,380
Interest Rate
7.31%
Mortgage Type
Unknown
Create a Home Valuation Report for This Property
The Home Valuation Report is an in-depth analysis detailing your home's value as well as a comparison with similar homes in the area
Home Values in the Area
Average Home Value in this Area
Purchase History
| Date | Buyer | Sale Price | Title Company |
|---|---|---|---|
| Holmes Raynette | -- | None Available | |
| Holmes Raynette | -- | None Available | |
| Holmes Raynette | -- | None Available | |
| Holmes Raynette | -- | None Available | |
| Holmes Stanley | $119,000 | -- | |
| Holmes Stanley | $119,000 | -- |
Source: Public Records
Mortgage History
| Date | Status | Borrower | Loan Amount |
|---|---|---|---|
| Open | Holmes Raynette | $162,171 | |
| Previous Owner | Holmes Stanley | $185,500 | |
| Previous Owner | Holmes Stanley | $152,000 | |
| Previous Owner | Holmes Stanley | $121,380 |
Source: Public Records
Tax History Compared to Growth
Tax History
| Year | Tax Paid | Tax Assessment Tax Assessment Total Assessment is a certain percentage of the fair market value that is determined by local assessors to be the total taxable value of land and additions on the property. | Land | Improvement |
|---|---|---|---|---|
| 2025 | $7,570 | $169,050 | $63,910 | $105,140 |
| 2024 | $7,159 | $169,050 | $63,910 | $105,140 |
| 2023 | $6,918 | $169,050 | $63,910 | $105,140 |
| 2022 | $6,877 | $169,050 | $63,910 | $105,140 |
| 2021 | $6,553 | $154,490 | $55,090 | $99,400 |
| 2020 | $5,963 | $142,660 | $49,560 | $93,100 |
| 2019 | $5,963 | $142,660 | $49,560 | $93,100 |
| 2018 | $5,849 | $142,660 | $49,560 | $93,100 |
| 2017 | $5,855 | $142,660 | $49,560 | $93,100 |
| 2016 | $5,512 | $139,510 | $54,600 | $84,910 |
| 2015 | $5,345 | $139,510 | $54,600 | $84,910 |
| 2014 | $5,213 | $139,510 | $54,600 | $84,910 |
Source: Public Records
Map
Nearby Homes
- 115 Northbrook Dr
- 2 Croydon Dr
- 9 Timberwood Rd
- 15 Sunny Reach Dr
- 12 Haviland Rd
- 645 Bloomfield Ave
- 537 Bloomfield Ave
- 171 N Canaan St
- 165 Bloomfield Ave
- 180 Brookline Ave
- 67 Simpson St
- 147 Morningside St W
- 111 Bloomfield Ave
- 179 Manchester St
- 181 Westminster St
- 53 Hillcrest Ave
- 12 Garrison Terrace
- 7 Emerson St
- 86 Hartland St
- 77 Harold St
- 20 Greenbrier Dr
- 14 Greenbrier Dr
- 27 Alderwood Dr
- 24 Greenbrier Dr
- 12 Greenbrier Dr
- 23 Alderwood Dr
- 29 Alderwood Dr
- 19 Alderwood Dr
- 17 Greenbrier Dr
- 33 Alderwood Dr
- 11 Greenbrier Dr
- 21 Greenbrier Dr
- 26 Greenbrier Dr
- 10 Greenbrier Dr
- 17 Alderwood Dr
- 23 Greenbrier Dr
- 35 Alderwood Dr
- 7 Greenbrier Dr
- 30 Greenbrier Dr
- 49 Portage Rd