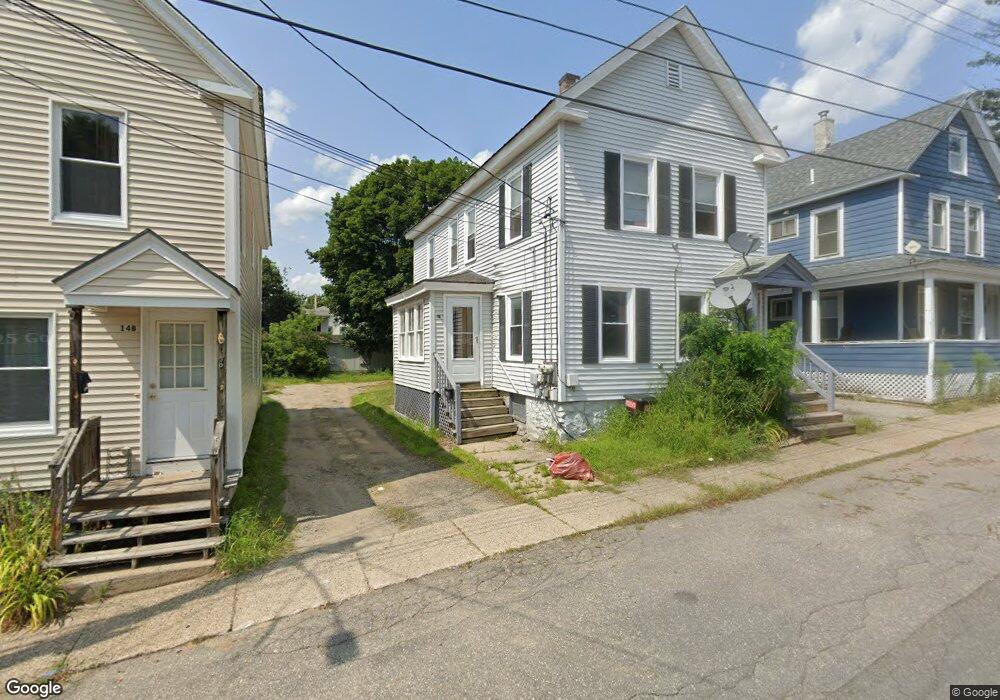
18 Hammond St Sanford, ME 04073
Estimated Value: $214,000 - $348,000
4
Beds
2
Baths
1,296
Sq Ft
$226/Sq Ft
Est. Value
About This Home
This home is located at 18 Hammond St, Sanford, ME 04073 and is currently estimated at $293,169, approximately $226 per square foot. 18 Hammond St is a home located in York County with nearby schools including Sanford Christian Academy and St Thomas Consolidated School.
Ownership History
Date
Name
Owned For
Owner Type
Purchase Details
Closed on
Jan 29, 2007
Sold by
Us Bank Na Tr
Bought by
Heptig Bonnie M
Current Estimated Value
Home Financials for this Owner
Home Financials are based on the most recent Mortgage that was taken out on this home.
Original Mortgage
$96,400
Outstanding Balance
$57,123
Interest Rate
6.15%
Mortgage Type
Purchase Money Mortgage
Estimated Equity
$236,046
Purchase Details
Closed on
Jun 13, 2005
Sold by
Peguero Boris A
Bought by
Ricker Shane
Home Financials for this Owner
Home Financials are based on the most recent Mortgage that was taken out on this home.
Original Mortgage
$132,000
Interest Rate
5.79%
Mortgage Type
Purchase Money Mortgage
Create a Home Valuation Report for This Property
The Home Valuation Report is an in-depth analysis detailing your home's value as well as a comparison with similar homes in the area
Home Values in the Area
Average Home Value in this Area
Purchase History
| Date | Buyer | Sale Price | Title Company |
|---|---|---|---|
| Heptig Bonnie M | -- | -- | |
| Ricker Shane | -- | -- | |
| Ricker Shane | -- | -- |
Source: Public Records
Mortgage History
| Date | Status | Borrower | Loan Amount |
|---|---|---|---|
| Open | Ricker Shane | $96,400 | |
| Previous Owner | Ricker Shane | $132,000 |
Source: Public Records
Tax History Compared to Growth
Tax History
| Year | Tax Paid | Tax Assessment Tax Assessment Total Assessment is a certain percentage of the fair market value that is determined by local assessors to be the total taxable value of land and additions on the property. | Land | Improvement |
|---|---|---|---|---|
| 2025 | $2,909 | $170,100 | $22,000 | $148,100 |
| 2024 | $2,745 | $170,100 | $22,000 | $148,100 |
| 2023 | $2,553 | $168,600 | $22,000 | $146,600 |
| 2022 | $2,495 | $168,600 | $22,000 | $146,600 |
| 2021 | $2,149 | $118,200 | $22,000 | $96,200 |
| 2020 | $2,335 | $115,800 | $22,000 | $93,800 |
| 2019 | $2,107 | $101,800 | $22,000 | $79,800 |
| 2018 | $2,087 | $101,800 | $22,000 | $79,800 |
| 2017 | $2,111 | $101,800 | $22,000 | $79,800 |
| 2016 | $1,821 | $80,100 | $22,000 | $58,100 |
| 2015 | $1,765 | $80,100 | $22,000 | $58,100 |
| 2014 | $1,695 | $76,700 | $22,000 | $54,700 |
| 2013 | -- | $78,400 | $22,000 | $56,400 |
Source: Public Records
Map
Nearby Homes