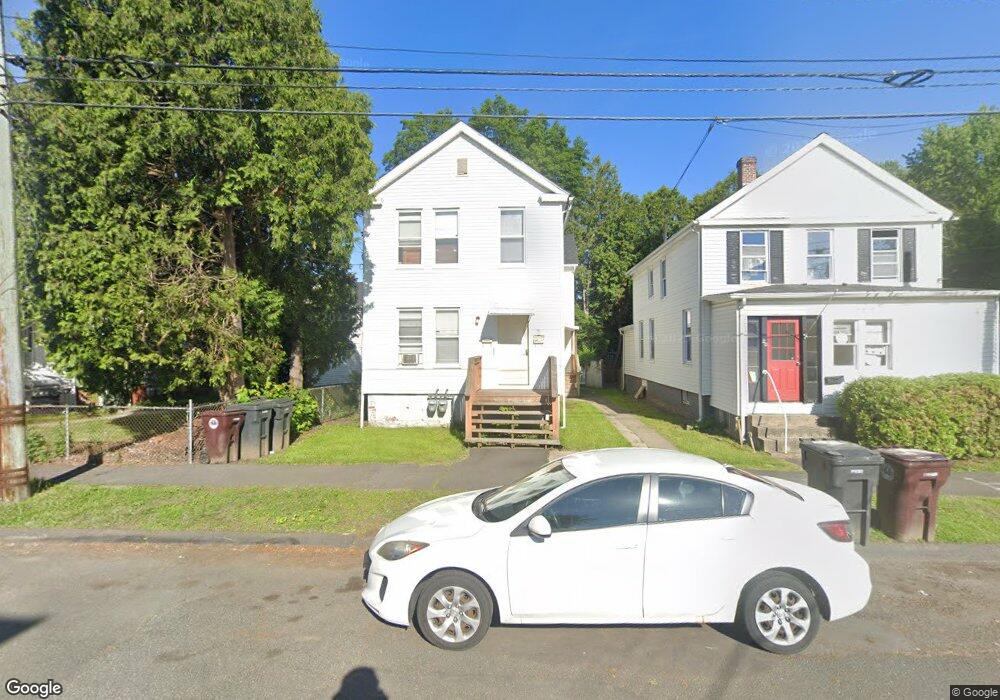
18 Hampden St Westfield, MA 01085
Estimated Value: $251,000 - $377,000
5
Beds
2
Baths
2,108
Sq Ft
$143/Sq Ft
Est. Value
About This Home
This home is located at 18 Hampden St, Westfield, MA 01085 and is currently estimated at $301,826, approximately $143 per square foot. 18 Hampden St is a home located in Hampden County with nearby schools including Westfield High School and Saint Mary High School.
Ownership History
Date
Name
Owned For
Owner Type
Purchase Details
Closed on
Sep 26, 2022
Sold by
Proud Properties Llc
Bought by
Prouty David S
Current Estimated Value
Home Financials for this Owner
Home Financials are based on the most recent Mortgage that was taken out on this home.
Original Mortgage
$190,500
Outstanding Balance
$181,447
Interest Rate
4.88%
Mortgage Type
Adjustable Rate Mortgage/ARM
Estimated Equity
$120,379
Purchase Details
Closed on
Oct 20, 2016
Sold by
Prouty David S
Bought by
Proud Properties Llc
Purchase Details
Closed on
Nov 21, 2008
Sold by
Predella Christopher R and Predella Margaret M
Bought by
Prouty David S
Home Financials for this Owner
Home Financials are based on the most recent Mortgage that was taken out on this home.
Original Mortgage
$126,000
Interest Rate
6.03%
Mortgage Type
Purchase Money Mortgage
Purchase Details
Closed on
Feb 17, 2005
Sold by
Predella Margaret M and Predella Richard P
Bought by
Predella Christopher R and Predella Margaret M
Purchase Details
Closed on
Jan 21, 2004
Sold by
Mikula Andrzej W
Bought by
Predella Margaret M and Predella Richard P
Purchase Details
Closed on
Aug 7, 2001
Sold by
Department Of Housing & Urban Dev
Bought by
Mikula Andrzej W
Purchase Details
Closed on
Oct 30, 2000
Sold by
Biascochea Rosalina and Countrywide Hm Loans
Bought by
Department Of Housing & Urban Dev
Purchase Details
Closed on
Feb 12, 1997
Sold by
Webber David J
Bought by
Biascochea Rosalina
Purchase Details
Closed on
Oct 19, 1992
Sold by
Park West B
Bought by
Blier Herbey
Purchase Details
Closed on
May 8, 1992
Sold by
Cadello Michael J
Bought by
Park West B
Create a Home Valuation Report for This Property
The Home Valuation Report is an in-depth analysis detailing your home's value as well as a comparison with similar homes in the area
Home Values in the Area
Average Home Value in this Area
Purchase History
| Date | Buyer | Sale Price | Title Company |
|---|---|---|---|
| Prouty David S | -- | None Available | |
| Prouty David S | -- | None Available | |
| Proud Properties Llc | -- | -- | |
| Proud Properties Llc | -- | -- | |
| Prouty David S | $157,000 | -- | |
| Prouty David S | $157,000 | -- | |
| Predella Christopher R | -- | -- | |
| Predella Christopher R | -- | -- | |
| Predella Christopher R | -- | -- | |
| Predella Margaret M | $149,000 | -- | |
| Predella Margaret M | $149,000 | -- | |
| Mikula Andrzej W | $38,500 | -- | |
| Mikula Andrzej W | $38,500 | -- | |
| Department Of Housing & Urban Dev | $85,953 | -- | |
| Department Of Housing & Urban Dev | $85,953 | -- | |
| Biascochea Rosalina | $68,000 | -- | |
| Webber David J | $58,000 | -- | |
| Biascochea Rosalina | $68,000 | -- | |
| Blier Herbey | $40,000 | -- | |
| Blier Herbey | $40,000 | -- | |
| Park West B | $30,000 | -- | |
| Park West B | $30,000 | -- |
Source: Public Records
Mortgage History
| Date | Status | Borrower | Loan Amount |
|---|---|---|---|
| Open | Prouty David S | $190,500 | |
| Previous Owner | Park West B | $119,000 | |
| Previous Owner | Prouty David S | $126,000 |
Source: Public Records
Tax History Compared to Growth
Tax History
| Year | Tax Paid | Tax Assessment Tax Assessment Total Assessment is a certain percentage of the fair market value that is determined by local assessors to be the total taxable value of land and additions on the property. | Land | Improvement |
|---|---|---|---|---|
| 2025 | $3,494 | $230,200 | $70,100 | $160,100 |
| 2024 | $3,454 | $216,300 | $63,800 | $152,500 |
| 2023 | $33 | $195,000 | $60,700 | $134,300 |
| 2022 | $3,260 | $176,300 | $54,200 | $122,100 |
| 2021 | $3,155 | $167,100 | $51,100 | $116,000 |
| 2020 | $3,042 | $158,000 | $51,100 | $106,900 |
| 2019 | $2,970 | $151,000 | $48,700 | $102,300 |
| 2018 | $2,631 | $135,900 | $48,700 | $87,200 |
| 2017 | $2,593 | $133,500 | $49,400 | $84,100 |
| 2016 | $2,595 | $133,500 | $49,400 | $84,100 |
| 2015 | $2,475 | $133,500 | $49,400 | $84,100 |
| 2014 | $1,847 | $133,500 | $49,400 | $84,100 |
Source: Public Records
Map
Nearby Homes