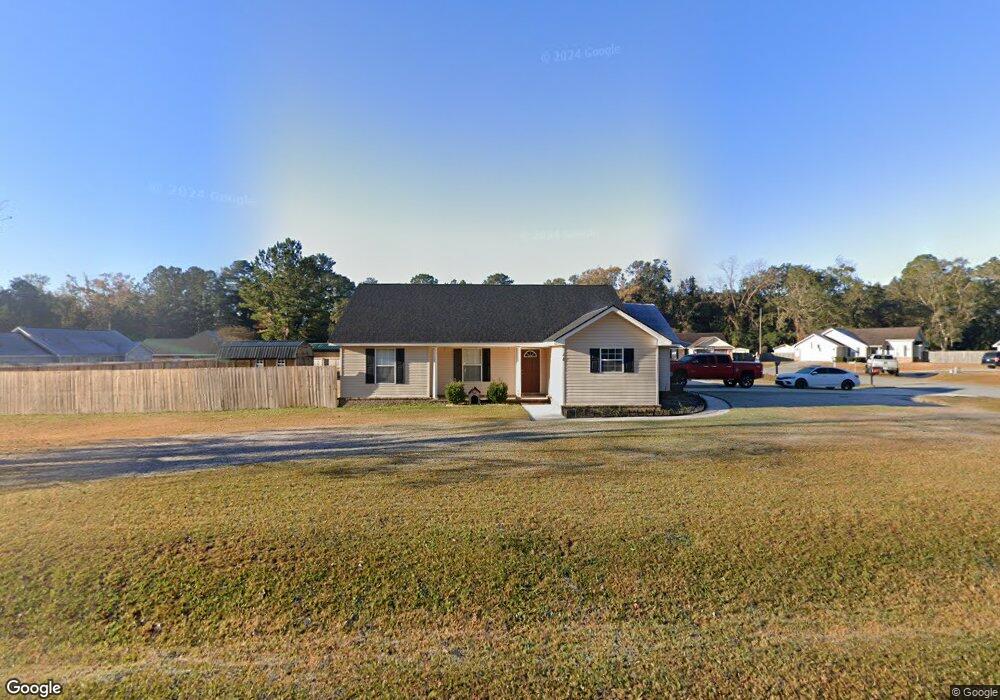
18 Hidden Creek Dr Guyton, GA 31312
Estimated Value: $270,382 - $288,000
3
Beds
2
Baths
1,283
Sq Ft
$218/Sq Ft
Est. Value
About This Home
This home is located at 18 Hidden Creek Dr, Guyton, GA 31312 and is currently estimated at $280,096, approximately $218 per square foot. 18 Hidden Creek Dr is a home located in Effingham County with nearby schools including Guyton Elementary School, Effingham County Middle School, and Effingham County High School.
Ownership History
Date
Name
Owned For
Owner Type
Purchase Details
Closed on
Oct 21, 2010
Sold by
Caron Claudine
Bought by
Guthrie Jeremy W
Current Estimated Value
Purchase Details
Closed on
Mar 18, 2010
Sold by
Caron Claudine
Bought by
Guthrie Jeremy W
Home Financials for this Owner
Home Financials are based on the most recent Mortgage that was taken out on this home.
Original Mortgage
$122,500
Interest Rate
4.91%
Mortgage Type
New Conventional
Purchase Details
Closed on
Sep 29, 2006
Sold by
Chapman Jason G
Bought by
Caron Claudine
Home Financials for this Owner
Home Financials are based on the most recent Mortgage that was taken out on this home.
Original Mortgage
$126,350
Interest Rate
6.36%
Mortgage Type
New Conventional
Purchase Details
Closed on
Sep 22, 2006
Sold by
Chapman Carmen C
Bought by
Chapman Jason G
Home Financials for this Owner
Home Financials are based on the most recent Mortgage that was taken out on this home.
Original Mortgage
$126,350
Interest Rate
6.36%
Mortgage Type
New Conventional
Create a Home Valuation Report for This Property
The Home Valuation Report is an in-depth analysis detailing your home's value as well as a comparison with similar homes in the area
Home Values in the Area
Average Home Value in this Area
Purchase History
| Date | Buyer | Sale Price | Title Company |
|---|---|---|---|
| Guthrie Jeremy W | $122,500 | -- | |
| Guthrie Jeremy W | $122,500 | -- | |
| Caron Claudine | $133,000 | -- | |
| Chapman Jason G | -- | -- |
Source: Public Records
Mortgage History
| Date | Status | Borrower | Loan Amount |
|---|---|---|---|
| Previous Owner | Guthrie Jeremy W | $122,500 | |
| Previous Owner | Caron Claudine | $126,350 |
Source: Public Records
Tax History Compared to Growth
Tax History
| Year | Tax Paid | Tax Assessment Tax Assessment Total Assessment is a certain percentage of the fair market value that is determined by local assessors to be the total taxable value of land and additions on the property. | Land | Improvement |
|---|---|---|---|---|
| 2025 | $3,312 | $101,727 | $22,800 | $78,927 |
| 2024 | $3,312 | $95,092 | $22,800 | $72,292 |
| 2023 | $2,078 | $70,711 | $17,600 | $53,111 |
| 2022 | $2,164 | $67,911 | $14,800 | $53,111 |
| 2021 | $2,068 | $63,190 | $15,000 | $48,190 |
| 2020 | $1,868 | $56,804 | $12,000 | $44,804 |
| 2019 | $1,831 | $54,804 | $10,000 | $44,804 |
| 2018 | $1,680 | $51,612 | $10,000 | $41,612 |
| 2017 | $1,670 | $51,612 | $10,000 | $41,612 |
| 2016 | $1,550 | $48,109 | $10,000 | $38,109 |
| 2015 | -- | $43,277 | $6,800 | $36,477 |
| 2014 | -- | $37,212 | $4,000 | $33,212 |
| 2013 | -- | $37,212 | $4,000 | $33,212 |
Source: Public Records
Map
Nearby Homes
- 3 Hidden Path
- 24 Hidden Creek Dr Unit B
- 0 Little McCall Rd Unit SA342297
- 0 Highway 119 S Unit SA339898
- 121 Little McCall Rd
- 233 Caroline Way
- 216 Caroline Way
- 2575 Hwy 119 S
- 119 Sabel Dr
- 2277 Georgia 119
- The Burton Plan at Guyton Station - Guyton Station
- The Cypress Plan at Guyton Station - Guyton Station
- The Jasmine Plan at Guyton Station - Guyton Station
- The Bellamy Plan at Guyton Station - Guyton Station
- The Clayton Plan at Guyton Station - Guyton Station
- The Clayton (4bdr) Plan at Guyton Station - Guyton Station
- 405 Magnolia St
- 602 Magnolia St
- 401 W Central Blvd
- 206 Glick Way
- 2 Hidden Path
- 0 Hidden Path
- 20 Hidden Creek Dr
- 7 Creek Walk
- 17 Hidden Creek Dr
- 16 Hidden Creek Dr
- 19 Hidden Creek Dr
- 6 Hidden Path
- 6 Creek Walk
- 6 Hidden Path 57
- 4 Hidden Path
- 21 Hidden Creek Dr
- 5 Hidden Path
- 13 Hidden Creek Dr
- 5 Creek Walk
- 23 Hidden Creek Dr
- 22 Hidden Creek Dr
- 2 Creek Walk
- 11 Hidden Creek Dr
- 4 Creek Walk